That’s a strange stance to take. There are lots of developers reading this forum. Blender is open source. There are developers who are not core developers, but who might be interested in looking into stuff like this.
Why would you make the chance of anything improving actively worse? I don’t get it.
Because it’s useless to take my scene. I think that Blender developers actually know that Cycles X is slower on lower end PCs (I was reading some months old post from Brecht, when Cycles X was in alpha). I just want them to do something about it as fast as possible!
Please try not to repeatedly tag developers in your posts. The Cycles developers are reading this thread regularly, and frequently tagging them is bothersome. Thanks.
rendering ±20.000.000 instances
8:30min of init time peak memory: 8.8Gb
comment: quite difficult, 10 min freeze upon cancellation
rendering ±40.000.000 instances
comment: impossible? initialization will freeze to death for me, render will just stop. (edit, i herrd processing can take up to 30min in such case?)
What can explain such scaling? why such memory consumption? I remember Cycles from 2.93 capable of rendering billions of instances, now we seem to be stuck at 40millions? i’m not sure what happened. may i tag @JuanGea you might be interested by this new limitation
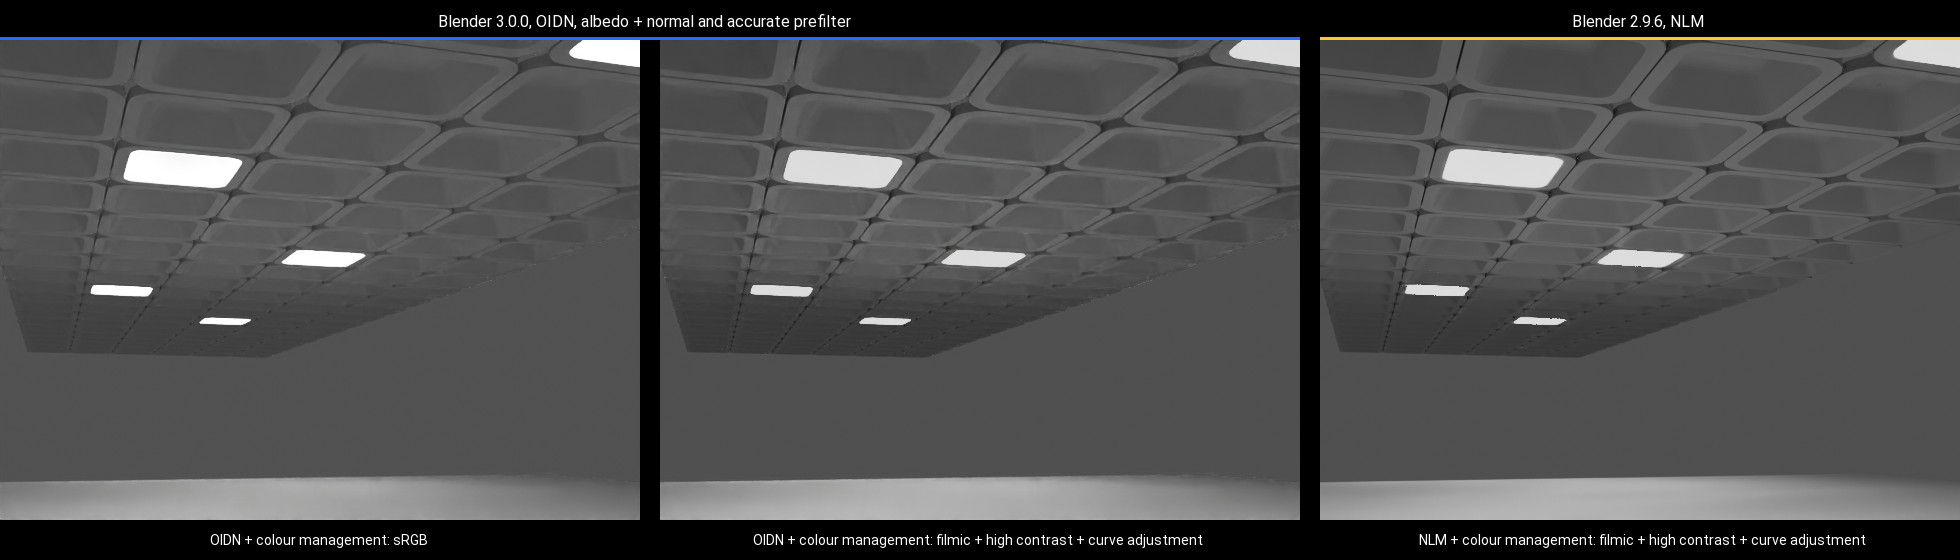
Yes, albedo + normal passes with the accurate prefilter.
I also wondered that as the mesh is quite low-poly, the surface might not be sufficiently smooth on the normals pass. But adding a subdivision modifier didn’t help here. The overall contrast on the base render is quite low and the blotches are somewhat more apparent after enabling filmic + high contrast + curve adjustment:
i am running in some weird rendering performance with 4x gtx1080ti system and blender 3.0 RC.
when rendering a very simple scene (cube+sphere) with default init cycles settings, i get approx. 42sec.
enableing only 2 gpus in the prefs, gives me approx. 7-10sec.
in 2.93.x the same scene with same settings gives me approx. 3sec with 4x gpus.
could it be that blender 3.0 and cycles x is hardcoded to max 2 GPUs?
also the gpu load in blender 3.0 is only 16-26% on my 4x gpu system, but in 2.93 its 100% load…
does anybody also experiance this behaviour with multi-gpu (more than two gpus)?
Are you sure about billions of instances? It should be pretty easy to test, it’s not like Blender Foundation has disabled your 2.93 license.
I tried a simple scene with 5 million monkeys on a plane using the old particle system (because geometry nodes changed too much) and both 2.93 and 3.0 were pretty similar with 33-35s for initialization and 1.5gb memory usage. But Blender itself used over 10gb so billions of instances would require terabytes of RAM and an absurd amount of time to even start rendering.
I would imagine that each instance requires a bit of memory to store its attributes. So even if it’s less than 1kb per instance, it quickly adds up when you have millions of them. Although judging by your numbers, scaling is not linear so there’s something else going on.
Could the memory allocation just be exponential? That is, memory was allocated for new instances in turn, using a 2-fold increase and just experiments gave exactly 2, 4, 8 …?
In T82383#1249471, brecht wrote:
When adaptive sampling is unable to detect the noise early enough, that’s leads to structured artifacts. The solution then is to increase the minimum number of samples.
While we will work on improving adaptive sampling to reduce the cases where this happens, this interaction between denoising and adaptive sampling is not a bug, but an indication we can improve our adaptive sampling algorithms further.
Adaptive sampling in general is a complex topic that has brought a lot of proposed algorithms over the years (each with their own strengths and drawbacks).
Among the complexities is how to properly handle tonemapped data, one could try to adaptively adjust the threshold so it is higher in bright areas and lower in darker areas, but it could result in a lot of noise showing up during color grading.
Hi all, It’s hard to keep track of the thread, so I apologize in advance if It’s a known Issue.
I don’t have any example to show since It’s an issue encountered in studio.
We are testing blender 3.0 in production , we render on multiple network machines , some of them has 20 and 30 series nvidia RTX cards, capable of Optix rendering mode, and some of them just 10 series Cards, so we just rely on CUDA for frame rendered on these machines.
With volume render, CUDA and Optix give slightly different results, and in particular, Optix seem not correct, since it has visible banding and The scene rendered are the same, just different frames. We are relying on CUDA, which is still blazing fast on Cycles X, but It would be nice to know if it’s a bug/known limitation or there is something that can fix it.
The volume is just a big atmospheric cube with emission, scatter and absorbtion , and the density is driven by an animated noise and a gradient texture. The camera is initially outside of the volume, and If I well remember it enters the volume at a certain point.
It would be great if you could provide a test file and create a bug report. To create a bug report, select from the top of Blender Help -> Report a bug and fill out all the relevant information.