Project Title
Spreadsheet improvements
Name
Chenyi Wang
Contact
email: [email protected]
blender chat: aiden
Synopsis
Add many useful features for spreadsheet.
Benefits
Now the spreadsheet lacks some important features as a spreadsheet, such as column filter, sort and others. With new features, artists can use the geometry node editor more conveniently and intuitively.
Deliverables
New features:
- Show corresponding node in 3d viewport
Now the spreadsheet can display rows that have been selected in a 3D viewport. In reverse, when clicking one or more rows, the corresponding elements (maybe point, edge, or face) should be highlighted. Related idea: link
In my vision, only the VERTEX can be clicked. When a vertex row is clicked, if the 3d viewport is in modify mode, vertex select, only selected vertex is highlighted.
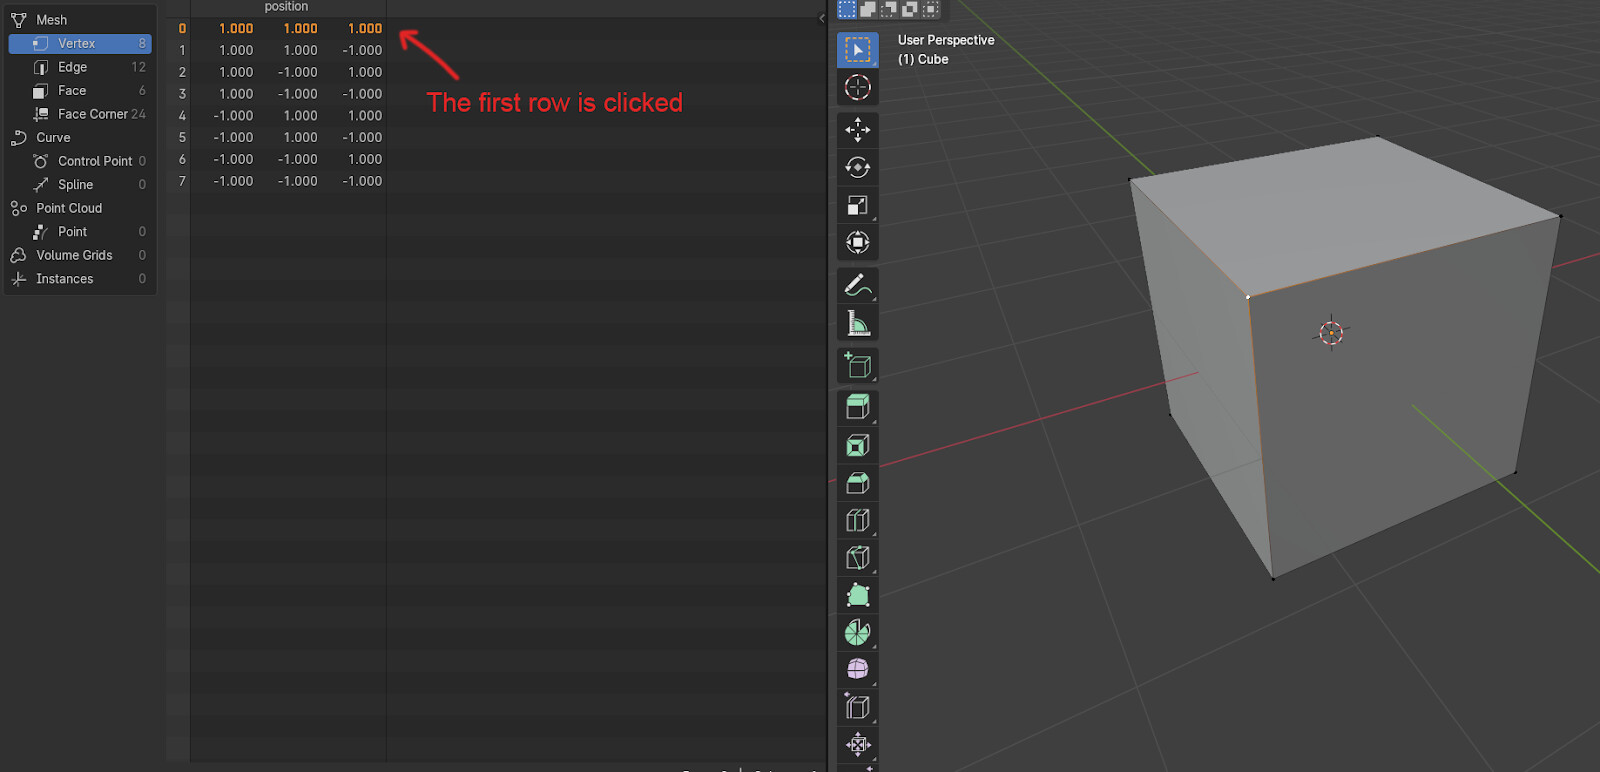
And if the 3d viewport is in edge or face select, all of the elements containing selected vertex will be highlighted.
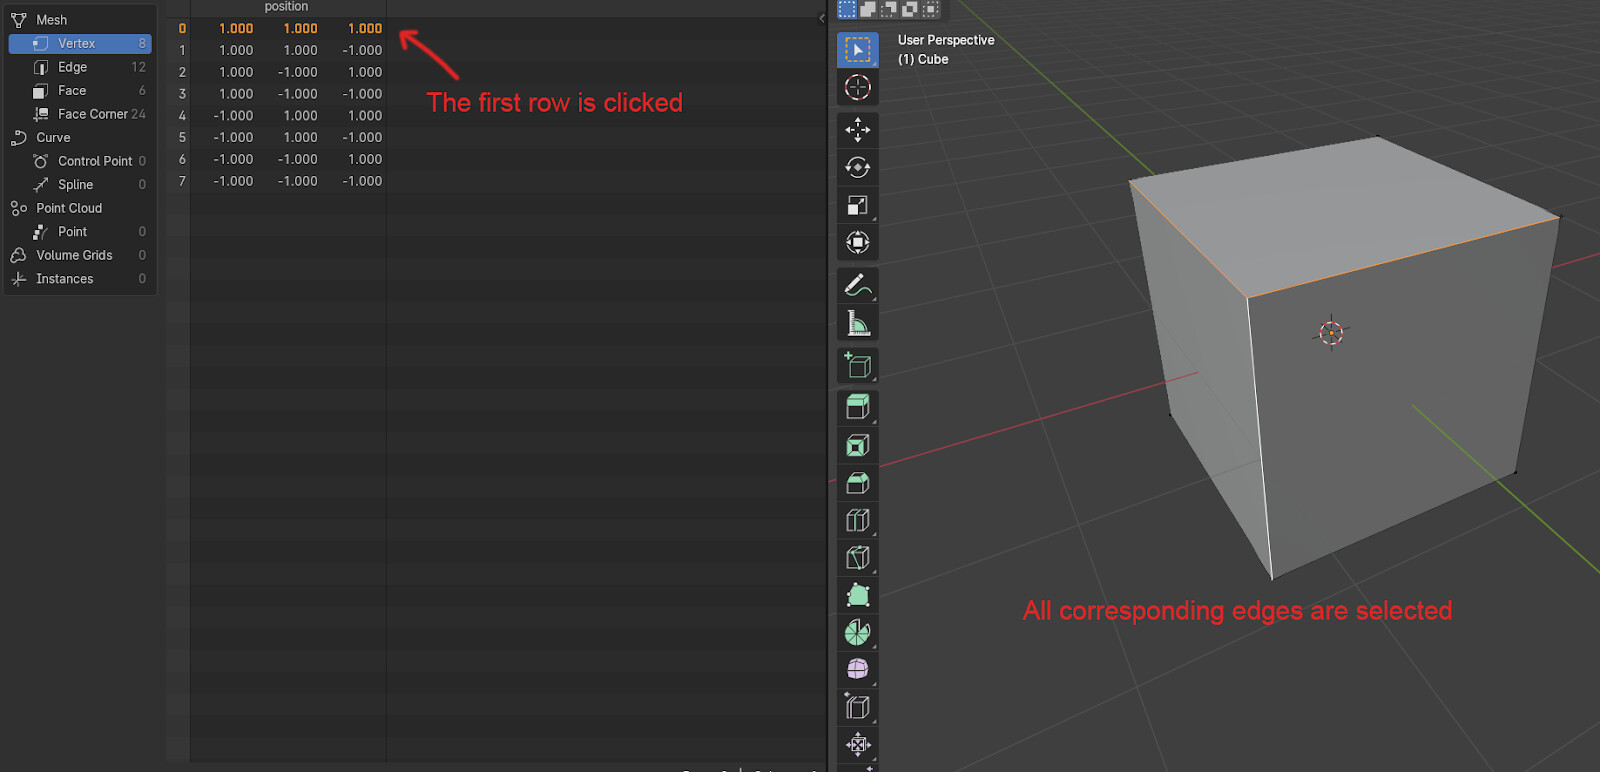
When multiple vertices are selected (we can use “ctrl” to select multiple vertices and use “shift” to select vertices from first click to second click, like in other applications), all related elements are highlighted.
- Column filter
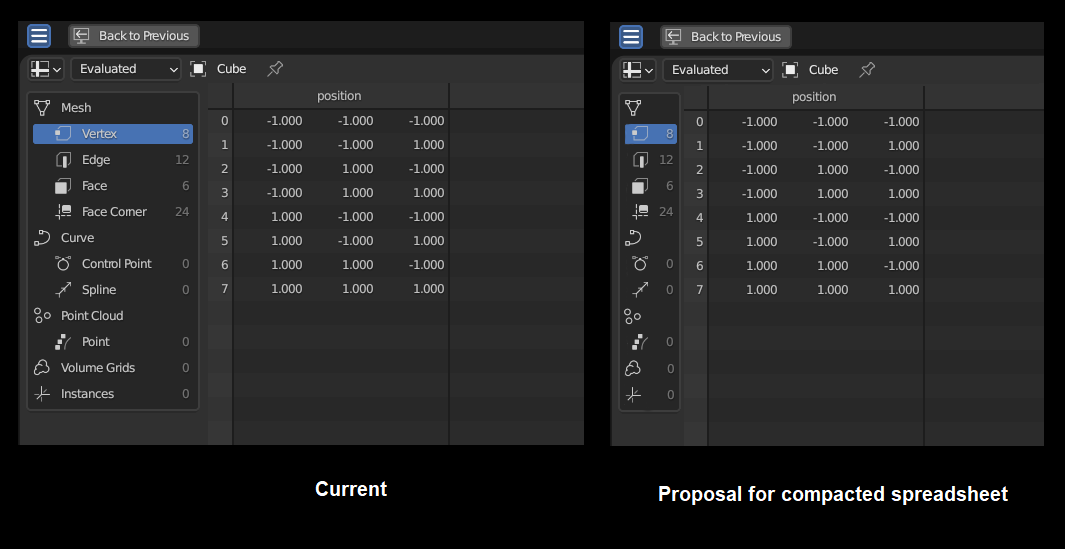
The spreadsheet has row filter now, but as one user said in rightclick, there should be a column filter. If there are a lot of attributes in the table, an artist may want to see only a few attributes and ignore others that might interfere with his or her work.
Solution A:
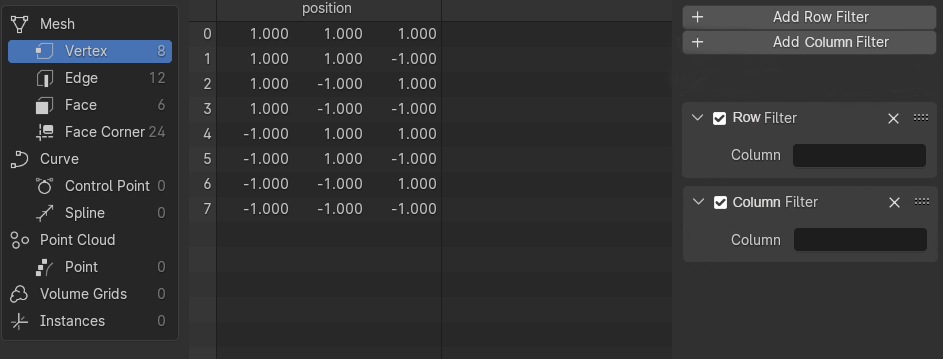
Besides the row filter, now we add a button named “add column filter”. If we type “position” in the column filter, then only the attribute “position” will be shown in the table. If we want to show two or more chosen attributes, then just add enough column filters.
pros:
- Keep consistent with the row filter.
- Easy to design UI (just add a button and a panel).
cons:
- For beginners, it may be hard to find this filter.
- Not intuitive. Someone may want to use a column filter by just clicking, not by typing words.
Solution B:
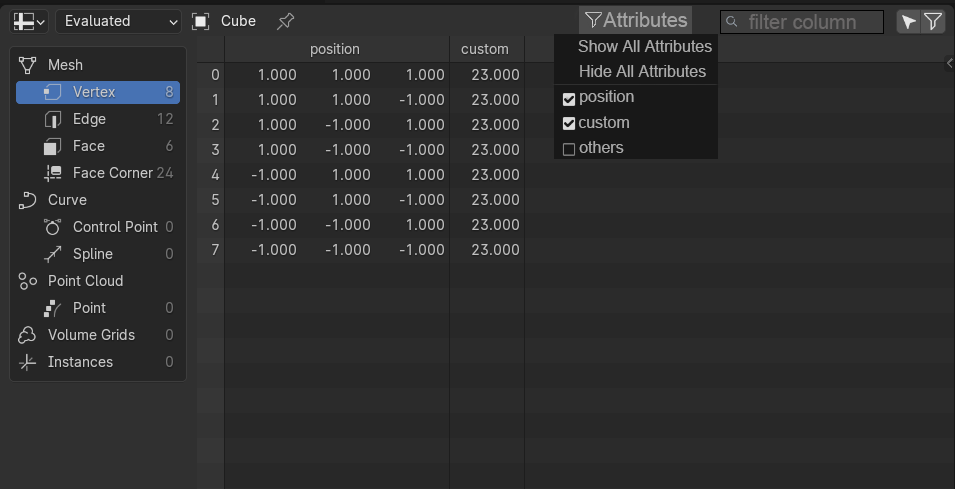
In this solution, we can add a filter menu and an input area. By clicking the filter menu, we can choose which attributes should be displayed in the spreadsheet, or we can choose to show/hide all attributes. In the input area, we can input text and show the attributes that fit the text. The input should accept regexes. For example, if we input “a.*”, then all attributes starting with “a” should be displayed. Only the attributes corresponding to the filter AND input should be displayed.
pros:
- It is convenient and easy for users to filter attributes.
cons:
- The regex is powerful but hard to learn for some users. Although users can type simple strings such as “a” to filter all attributes whose name contains “a”.
- May be weird that the column filter and row filter are not in the same place. The old filter tooltip “use filter” should be changed to “use row filter”
- Collapse left panel
When a user shrinks the left panel, the words may overlap with numbers making it hard to read.
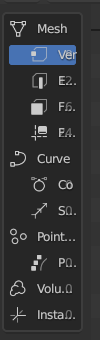
So when the width is too small, the words should not be displayed. I am not sure if it is useful, so I may mark it low priority. Related idea: link
Should we not show icon names all the time or only when the width is too small? In both solutions, when users hover their mouse over an icon, there should be a tooltip hinting at the icon name.
- Add fine-grained number display
Now the numbers in the table can only be displayed to three decimal places. A user complained about this as he usually works with nodes that have much smaller values. So if the attribute number is too small, we can display it using scientific notation, such as “1.11e-5” rather than 0.000. Related idea: link
We can also set the column width (see below) to display the very small number, such as “0.0000111”. But I think “1.11e-5” is better.
- Display matrix data (or any other long data) in spreadsheet
I noticed in 4.2, there is a new data type “matrix” in the spreadsheet which cannot be displayed for now. We can make the column width be set manually and no matter how long the data is (like “matrix”), users can drag to set the column width to see the data.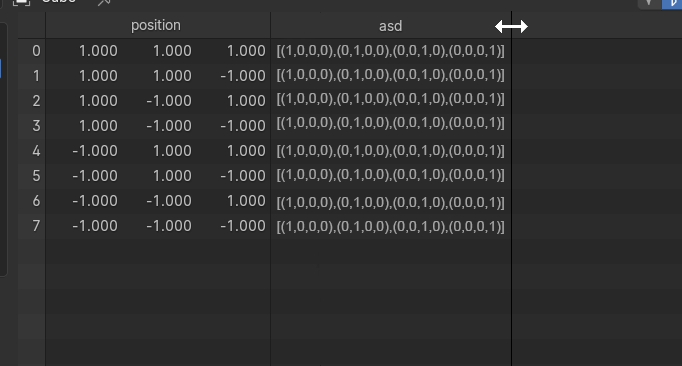
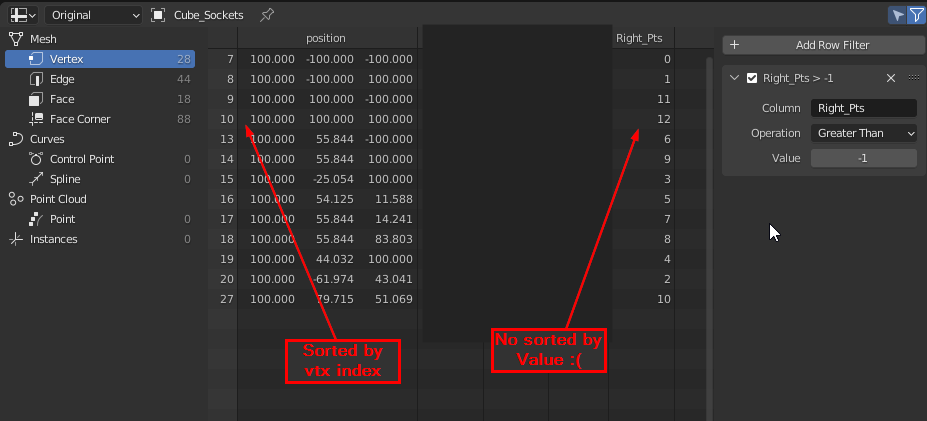
- Add sort function
As a user said, the sheet should be sorted by certain attributes. If there are multiple values in one attribute(like position, there are three values x, y, z), every time a user clicks the column(“postion”), the sort value should loop in all values(x, y, z). Related idea: link
- Export data
I found a user saying that someone may want to export data out of a spreadsheet. However, someone suggested that this should be done by an extension rather than blender itself. The idea page has shown this feature, so anyhow, I may add it to the to-do list.
Bug
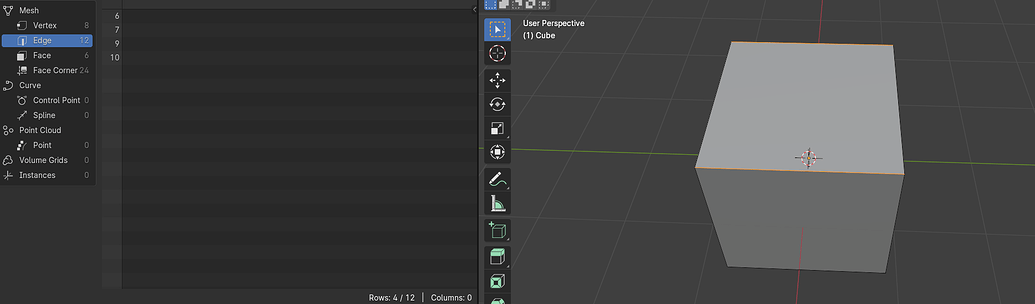
I find an interesting thing when I use the geometry editor and I am not sure if it is a bug or a feature.
You can see when I box only the top and bottom two edges, the spreadsheet displays four edges rather than two. The other two edges are left and right edges.
Others
Any necessary documents to help users use new features quickly and easily.
Project Details
I think in the “Deliverables” section, I have described everything in detail. But if there is something else I missed, I will add it here right away.
Project Schedule
The whole project is scheduled to take 15 weeks.
- Week 1 Get myself familiar with spreadsheet related codes. How the spreadsheet is rendered, how does spreadsheet get 3d objects data, how to modify these data, etc.
- Week 2 Collapse left panel
- Weak 3 Add fine-grained number display
- Weak 4 Show long data/Make column draggable
- Weak 5 Add sort function
- Weak 5 Column filter
- Weak 7~8 Export data
- Weak 9~10 Show corresponding elements in 3d viewport
- Weak 11 Bug fix (if exist)
- Weak 12 Document
- Weak 13~15 For possible emergency things. I am a postgraduate student and will graduate in 2025.6. So I may be busy sometimes for any reason like graduate paper, summer vacation, intern and others. I will leave two or more weeks for these unforeseen circumstances.
I will start the project as soon as I post the proposal, and get myself familiar with spreadsheet related codes.
Bio
I am wang chenyi(wang is the family name), a postgraduate student majoring in software engineering, AIOPS(Algorithmic IT Operations) in China. I have learned computer graphics by myself for about two years, including modern computer graphics algorithm and technology(MVP transformation, some anti-aliasing theorem and technology, basic ray tracing algorithm, and some basic knowledge of vulkan and OpenGL). I have not joined in any “huge” CG related projects, except some small exercises or homework of CG lessons.
I have been learning blender for only about half a year out of interest. Now I am a newbie in Blender, but I am confident that I have enough knowledge to make it better.
Here are my previous works for open source community:
Blender:
- #119146 - Overlay: Edit Mesh: Add anti-alising on normal lines - blender - Blender Projects add anti-aliasing for normal lines in modify mode
K8s related:
- add support of reading certificate-authority file by swhoro · Pull Request #198 · kubernetes-client/c (github.com) reading certificate-authority from file rather than directly from string
others:
- add import-series by swhoro · Pull Request #3884 · the1812/Bilibili-Evolved (github.com) add a new function for a community tool