Since this issue was reopened: https://developer.blender.org/T73460, and I have machine with dual RVII GPUs, I’ve decided to bench this cards under Linux.
OS: Linux, Debian Buster 64 bit, kernel: 5.4.0-0.bpo.2-rt-amd64 (5.4.8-1~bpo10+1; amd64)
CPU: AMD Threadripper 3970x
GPU_1: AMD Radeon VII (Gigabyte)
GPU_2: AMD Radeon VII (MSI)
(VEGA20, DRM 3.35.0, 5.4.0-0.bpo.2-rt-amd64, LLVM 7.0.1)
OpenGL core profile version string: 4.5 (Core Profile) Mesa 18.3.6
OpenGL core profile shading language version string: 4.50
OpenGL core profile context flags: (none)
OpenGL core profile profile mask: core profile
OpenGL core profile extensions:
OpenGL version string: 4.5 (Compatibility Profile) Mesa 18.3.6
OpenGL shading language version string: 4.50
OpenGL context flags: (none)
OpenGL profile mask: compatibility profile
OpenGL extensions:
OpenGL ES profile version string: OpenGL ES 3.2 Mesa 18.3.6
OpenGL ES profile shading language version string: OpenGL ES GLSL ES 3.20
OpenGL ES profile extensions:
The installation of the whole amdgpu-pro proprietary driver failes with the above configuration, so I installed only selected packages. At this point I want to thank @joules, and the rest of the people in this thread, as they helped to enable OpenCL in the first place: Can't enable OpenCL for AMD RX 5700 XT on Linux - #11 by silex. I want to confirm, that until following packages were installed OpenCL rendering was not available in Blender - something obvious for many, but since.
amdgpu-core_19.50-967956_amd64.deb
   ∟amdgpu-pro-core_19.50-967956_amd64.deb
   ∟libdrm2-amdgpu_19.50-967956_amd64.deb
   ∟libdrm-amdgpu-common_19.50-967956_amd64.deb
       ∟libdrm-amdgpu-amdgpu1_19.50-967956_amd64.deb
           ∟libopencl1-amdgpu-pro_19.50-967956_amd64.deb
opencl-amdgpu-procomgr_19.50-967956_amd64.deb
   ∟opencl-amdgpu-pro-icd_19.50-967956_amd64.deb
opencl-orca-amdgpu-pro-icd_19.50-967956_amd64.deb
clinfo-amdgpu-pro_19.50-967956_amd64.deb
opencl-amdgpu-pro-dev_19.50-967956_amd64.deb
opencl-amdgpu-pro-icd_19.50-967956_amd64.deb
GPU_1 is new. GPU_2 was used for mining, and I bought it second-hand. All temperatures measured at die junction. Measurement taken with Psensor.
At idle GPU’s bevior is pretty standard:
GPU_1: temp - 37C, fan - 845 RPM
GPU_2: temp - 34C, fan - 845 RPM
Under load:
GPU_1: temp - average - 85C, max - 104C, fan max 2380 RPM
GPU_2: temp - average - 92C, max - 103C, fan max 2926 RPM
The only thing I wasn’t able to check were vBIOS versions. If anyone knows how to extract them, that would be great.
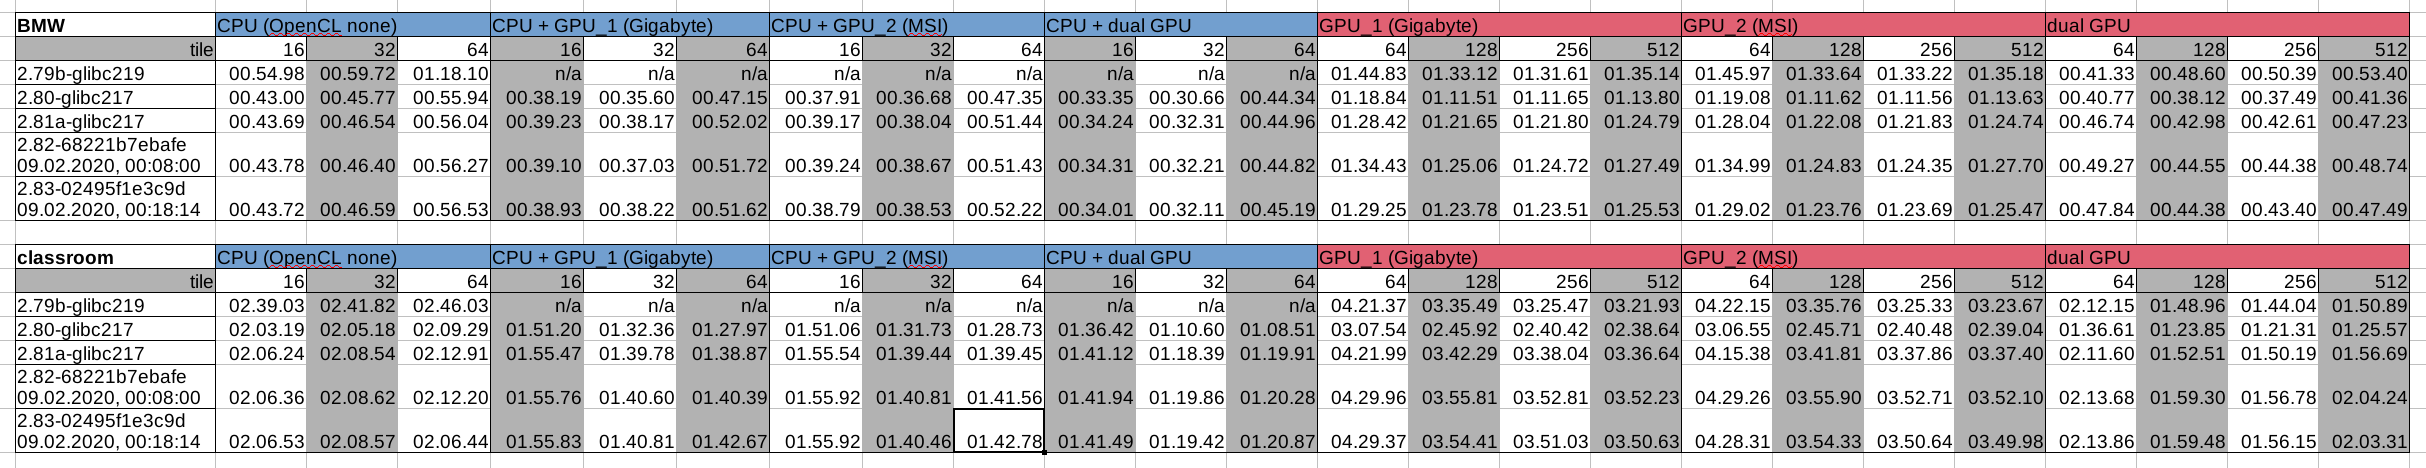
As you can see, I’ve tested two scenes with 5 different Blender releases and multiple tilesizes.
csv exported with default LibreOffice settings:
,,,,,,,,,,,,,,,,,,,,,,,,,
,BMW,CPU (OpenCL none),,,CPU + GPU_1 (Gigabyte),,,CPU + GPU_2 (MSI),,,CPU + dual GPU,,,GPU_1 (Gigabyte),,,,GPU_2 (MSI),,,,dual GPU,,,
,tile,16,32,64,16,32,64,16,32,64,16,32,64,64,128,256,512,64,128,256,512,64,128,256,512
,2.79b-glibc219,00.54.98,00.59.72,01.18.10,n/a,n/a,n/a,n/a,n/a,n/a,n/a,n/a,n/a,01.44.83,01.33.12,01.31.61,01.35.14,01.45.97,01.33.64,01.33.22,01.35.18,00.41.33,00.48.60,00.50.39,00.53.40
,2.80-glibc217,00.43.00,00.45.77,00.55.94,00.38.19,00.35.60,00.47.15,00.37.91,00.36.68,00.47.35,00.33.35,00.30.66,00.44.34,01.18.84,01.11.51,01.11.65,01.13.80,01.19.08,01.11.62,01.11.56,01.13.63,00.40.77,00.38.12,00.37.49,00.41.36
,2.81a-glibc217,00.43.69,00.46.54,00.56.04,00.39.23,00.38.17,00.52.02,00.39.17,00.38.04,00.51.44,00.34.24,00.32.31,00.44.96,01.28.42,01.21.65,01.21.80,01.24.79,01.28.04,01.22.08,01.21.83,01.24.74,00.46.74,00.42.98,00.42.61,00.47.23
,"2.82-68221b7ebafe 09.02.2020, 00:08:00",00.43.78,00.46.40,00.56.27,00.39.10,00.37.03,00.51.72,00.39.24,00.38.67,00.51.43,00.34.31,00.32.21,00.44.82,01.34.43,01.25.06,01.24.72,01.27.49,01.34.99,01.24.83,01.24.35,01.27.70,00.49.27,00.44.55,00.44.38,00.48.74
,"2.83-02495f1e3c9d 09.02.2020, 00:18:14",00.43.72,00.46.59,00.56.53,00.38.93,00.38.22,00.51.62,00.38.79,00.38.53,00.52.22,00.34.01,00.32.11,00.45.19,01.29.25,01.23.78,01.23.51,01.25.53,01.29.02,01.23.76,01.23.69,01.25.47,00.47.84,00.44.38,00.43.40,00.47.49
,,,,,,,,,,,,,,,,,,,,,,,,,
,classroom,CPU (OpenCL none),,,CPU + GPU_1 (Gigabyte),,,CPU + GPU_2 (MSI),,,CPU + dual GPU,,,GPU_1 (Gigabyte),,,,GPU_2 (MSI),,,,dual GPU,,,
,tile,16,32,64,16,32,64,16,32,64,16,32,64,64,128,256,512,64,128,256,512,64,128,256,512
,2.79b-glibc219,02.39.03,02.41.82,02.46.03,n/a,n/a,n/a,n/a,n/a,n/a,n/a,n/a,n/a,04.21.37,03.35.49,03.25.47,03.21.93,04.22.15,03.35.76,03.25.33,03.23.67,02.12.15,01.48.96,01.44.04,01.50.89
,2.80-glibc217,02.03.19,02.05.18,02.09.29,01.51.20,01.32.36,01.27.97,01.51.06,01.31.73,01.28.73,01.36.42,01.10.60,01.08.51,03.07.54,02.45.92,02.40.42,02.38.64,03.06.55,02.45.71,02.40.48,02.39.04,01.36.61,01.23.85,01.21.31,01.25.57
,2.81a-glibc217,02.06.24,02.08.54,02.12.91,01.55.47,01.39.78,01.38.87,01.55.54,01.39.44,01.39.45,01.41.12,01.18.39,01.19.91,04.21.99,03.42.29,03.38.04,03.36.64,04.15.38,03.41.81,03.37.86,03.37.40,02.11.60,01.52.51,01.50.19,01.56.69
,"2.82-68221b7ebafe 09.02.2020, 00:08:00",02.06.36,02.08.62,02.12.20,01.55.76,01.40.60,01.40.39,01.55.92,01.40.81,01.41.56,01.41.94,01.19.86,01.20.28,04.29.96,03.55.81,03.52.81,03.52.23,04.29.26,03.55.90,03.52.71,03.52.10,02.13.68,01.59.30,01.56.78,02.04.24
,"2.83-02495f1e3c9d 09.02.2020, 00:18:14",02.06.53,02.08.57,02.06.44,01.55.83,01.40.81,01.42.67,01.55.92,01.40.46,01.42.78,01.41.49,01.19.42,01.20.87,04.29.37,03.54.41,03.51.03,03.50.63,04.28.31,03.54.33,03.50.64,03.49.98,02.13.86,01.59.48,01.56.15,02.03.31
I hope this can shed some light on performance regression, and simmilar issues. The numbers are really interesting.