talking about the realtime feedback from grading with the compositor. With my window setup with composite nodes on top and viewport on the bottom; I can manipulate the image with realtime feedback. The feedback from the viewport compositor slows down when I enable gpu execution mode instead of tile or fullframe. I am not yet doing a final render at this point.
Before I noticed the performance hit when using the the image editor with (view node) but had not yet realized it slowed down the viewport compositor as well (not navigation but composite updates from modifying nodes) . The performance hit is not a huge hit, but a noticeable one. It is difference between realtime grading and not.
Your suggestions sound like like they will help the issue ; I just wanted to clarify.
I can confirm this. Every setting on every node is laggy when it is adjusted. This happens in the viewport in GPU mode, not in Tiled or Fullframe either. It seems like you can’t just slide and adjust the settings of the node in real-time. Also, if you are rendering a high-resolution image, go to the Composite tab with the backdrop enabled, and trying to adjust the node settings gets REALLY worse, too much lag, practically unusable.
@OmarEmaraDev Maybe it’s because the GPU compositor wants to update the image on the fly, even when you still have the mouse button pressed and are still adjusting the slide settings (like the color picker, for example). Perhaps, to remove the lag, the GPU compositor should wait for the mouse click to be released before applying the changes, allowing for the completion of adjustments.
First, the compositor superfluously executes even when its result is not viewed or used, as mentioned by Brecht above. This is not a problem for the CPU compositors because they execute in a different thread which has no effect on Blender drawing the UI. It is a problem for the GPU compositor because while it also executes in a different thread, we switch to a separate GPU context and submit work to that, so the UI drawing code and the compositor are fighting over the GPU. More on this in the second problem.
I will submit a fix for this problem soon.
Second, as I mentioned, the UI drawing code and the GPU compositor are fighting over the GPU. To fix this, there are two things we can do:
First, we can try to eliminate IO bottlenecks that makes this fighting worse. We already started doing that last week by introducing a complete cache for images. The same issue still exist at the output, where the compositor output is written to the viewer/composite images, so we still need to improve this. Further, some operations like OIDN denoising can make this worse, which I guess can be improved by using one of the GPU OIDN devices, but that seems unlikely for now.
Second, we can try to divide the compositor work into smaller chunks, which would allow GPU drivers to interleave the work better and make the UI stuttering less of an issue. Though this is just a theoretical idea that I have not confirmed or investigated yet.
@Emi_100 The idea you mentioned could be done, but it would make interactivity worst, which seems integral to compositing work.
@OmarEmaraDev It would be very nice if there was an option way to keep the Grease Pencil objects from being processed in the realtime viewport compositor. The lineart generally needs to keep its integrity throughout the compositing, although that is not always the case. For instance using kuwahara totally kills all the lineart GP look in the viewport.
I generally render the lineart as separate render passes, so it is not that hard to do in the actual compositing, but the realtime compositor does not handle render passes or aovs.
noticed this difference when using the laplace node between viewport comp and main comp (gpu exec). I figure it must be a precision difference , but brought it up just incase. While there differences between fullframe and gpu execution mode (for main comp), the difference is minimal compared to viewport comp
I can try making you a test build for now. Since I am still not sure about the side effects of this option or whether we want to have it at this point.
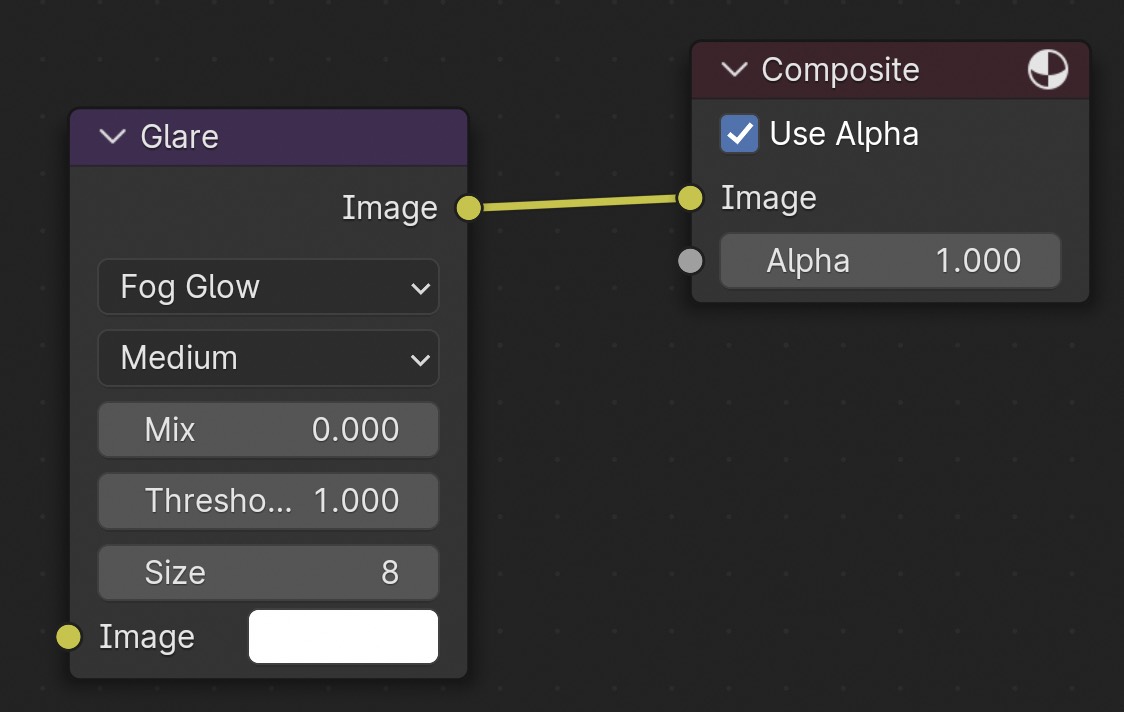
Thanks for the report. I can reproduce the crash. Though it seems to happen for unconnected Glare node instead of Kuwahara. Probably related to @izo recent work on constant folding.
@kurk@frogstomp I published test builds with an option to exempt grease pencil from from compositing. Should be available at Blender Builds - blender.org once the build-bot finishes creating the builds.
@dracoroot7@Emi_100 The issue about slow updates when GPU execution is selected even when backdrop is disabled should be solved. Though if the backdrop is enabled, the same issue remains, and we will make a fix for that in the future.
@dracoroot7 I can’t reproduce the issue with the Laplacian, maybe try the latest daily version and if the issue still persists, report a bug.
Thanks for the implementation. That works with my initial tests. I am not seeing additional perf impact but needs further testing, obviously. I would be personally happy to have this option during the 4.1 testing period which I use regularly, and most of my recent works are all stylized stuff which rely on the realtime compositor and the GP tools/drawings.
Could someone please add something about the control of the focal point to the defocus node documentation?
Using Blender 4.0 on an ancient AMD CPU, if I select “Use Z-Buffer” it assumes that the focal point is at 10m. To adjust the focal point it is necessary to multiply the depth information that is connected to the Z input by a suitable constant, e.g. if a focal point at 2m is required use 0.2.
cheers Matt
The focus distance is defined by the Depth Of Field > Focus Distance in the active camera in the scene selected in the node. Camera objects have a default focus distance of 10m, that’s why you noted that.
See the documentation here: