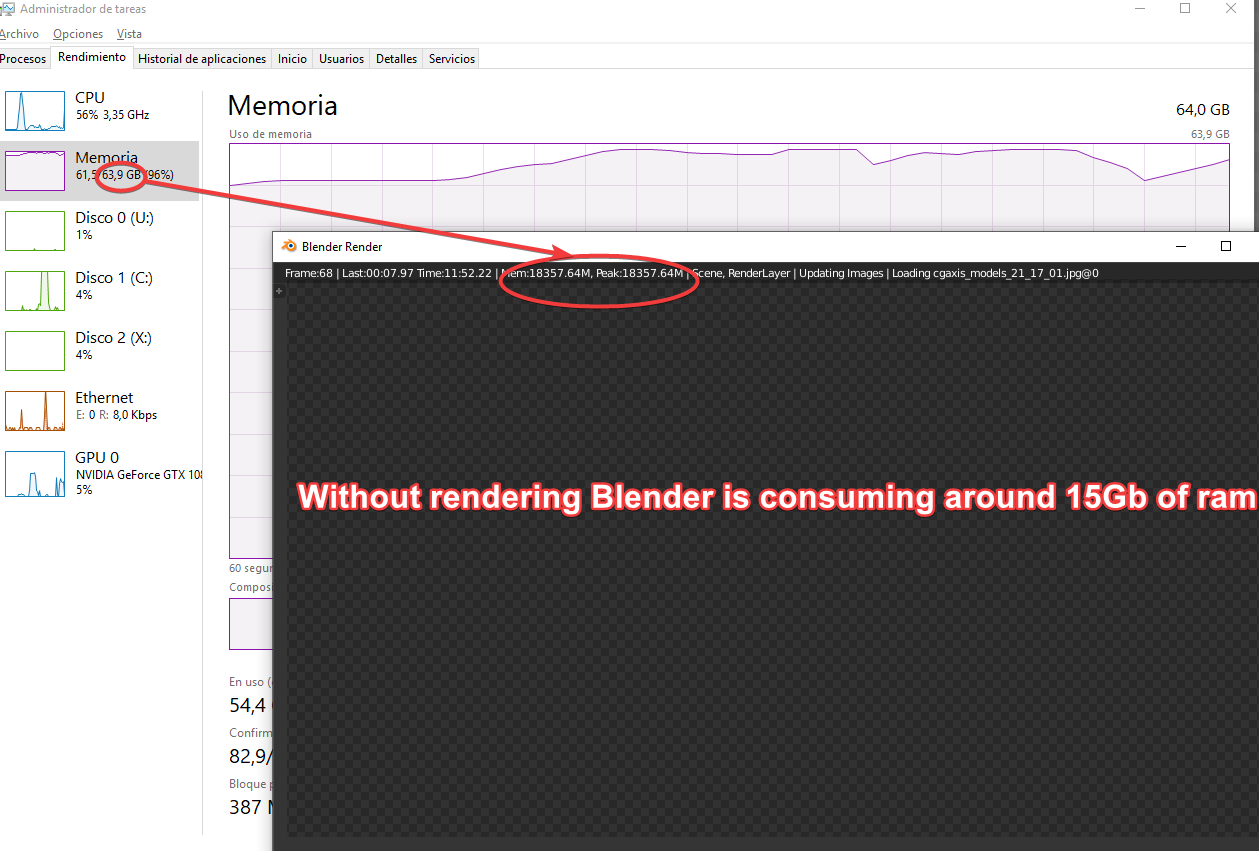
I have a big scene, right now when I launch the render the peak memory it says it´s 27Gb of ram, in the picture you can see a bit less but that is because the render was starting, and Blender uses itself around 15Gb of ram, but when I press render all my 64Gb of ram are filled.
What is the real memory amount I have to take into account to know how much ram do I need in a computer to render that scene?
Memory is needed obviously to load the blend file, so if your blend file is 15 GB you should not be surprised. Memory will be also be used to prepare data, for example even before rending begins, data has to be calculated etc which would increase memory usage. Then of course we have the case of real time rendering like Eevee or just regular viewport rendering. Secondary actions like baking etc will also require memory.
The amount of memory consumed usually depends on the amount of data used, so yes if you load a very large blend file it could multiple your memory consumption easily while rendering.
On the other hand without having the blend file and even having the pc required to test this, this is all theoretically. This could be a very rare bug.
The weirdest thing is that the blend file uses 15Gb of ram when I open it, that´s ok (the file is not 15Gb, it´s 2Gb but it has some links, so it may need 15Gb of ram, no doubt) after that cycles says that peak memory needed is 27Gb of ram, and after that window uses 6Gb of ram by itself without Blender, so if you sum up all that ram it says it needs 48Gb of ram, and my system has 64Gb of ram, but while rendering it goes over 64 Gb sometimes, so if at some point cycles needs more than 54gb, it should say 64Gb or whatever amount of ram it needs as peak, not 27Gb.
That is what is making me go crazy, because I don´t have any reliable information about what amount of ram do I need in a node to render this scene.
I am willing to bet on the OS numbers, mainly because its the OS that gives the RAM to Blender. An application cannot merely take the RAM itself, OS controls pretty much everything RAM wise.
It may be that Blender is not correctly reporting RAM consumption because you use so much of it, it used to be that 4 mil polygons for example were more than enough to crash Blender.
Another way to test this, is to build blender as a debug build, and launch it with the Visual Studio debugger , it has a memory profiler than keeps track of the RAM consumption. Making a debug build is as easy as making a regular build you just use “make debug”.
Or you can use tons of memory profilers that exist out there. If you have a lot of links that may be a reason why you get different numbers from Blender.
BUt what bothers me is not that the system reports a number or the other, because the memory is being filled, the problem is that Blender is not reporting the correct amount of ram, and I can do a memory profile or do a debug build, but the average user should be able to know how much ram is needed to render a scene.
Or maybe the amount of ram is correct and I´m going crazy (it could be… hahaha)
The window during rendering only shows the memory that the Cycles kernel itself allocated for rendering data. Depending on the settings, this may be system memory or VRAM.
This is by far not all the memory that Blender uses. Blender is further allocating memory for its data structures, for UI graphics, for geometry, etc. That is being tracked in the main Blender window.
In addition to that, the Blender code itself occupies memory, and so do file buffers, frame buffers, shared libraries, etc. This is what the windows task manger shows you.
The overall amount of physical memory used by the OS is mostly a useless number. The system can reserve memory in preparation of future allocations as well as use unoccupied memory for things like caching file I/O.
Another question, if I launch the render from the command line, will it “eat” less memory than rendering from the UI?
In the latest 2.79 build my current scene crashes and cannot be rendered from the command line, and in 2.8 it starts the render, but I have not been able to kill the output, so it´s sloooooow because I have tons of instances, yesterday I was 18 minutes watching instances output in the terminal after killing it hahaha (@sybren told me to download a proper terminal for windows… I still have to do it), BTW “–vervose 0” does not work, at least for me.
Also, the RAM shown by Cycles is the only one we should consider to render a scene with GPU´s?