Cycles feedback

I’ve been using my own node setup for this, but for each denoise node I plugged albedo and normal. Results where fine, no over contrasted textures, and much more detail than Oidn 1.3 Now with Oidn 1.4 results are much better, and I don’t need that extra step anymore.

Regarding AO (I was one sponsoring its return), if the long term plan is to have viewport real time compositor we might use a composite with AO pass, right?

Here an example where the OIDN node Group I shared above preserves the texture better than single OIDN node (See small table texture):

*3000 samples - No denoise
https://pasteall.org/pic/93bf76ad3a744e1e954dcc474e112c69

*800 samples - OIDN single node - Prefilter None
https://pasteall.org/pic/4a84ffca11264ae596468d2d359e614a

*800 samples - OIDN node Group - Prefilter Accurate
https://pasteall.org/pic/e9798e5ceda54abe9d464bcf352bdb36

Node Group’s result is as good as NLM at 2.93. Here the complete test with images and .blend file included:

You notice that OIDN node group result even amplifies the detail of the armchair texture compared to 3000 samples non-denoised render, which I’m not sure is always desirable. Anyway…

Edit:
I have noticed that in Viewport Rendered mode that table texture is better preserved than in Final render. I’m going to check it better tomorrow.

1 Like

Looking at the video you provided, it seems the final render is done at a lower resolution than your viewport rendering. If that is the case, then the final render is working with less information and as a result you will have a image with less detail.

1 Like

Oh, what you say makes sense. When I zoom in a lot in viewport as in video it increases the resolution (about 2x more than final render).

Hi.

I’m having a strange issue with this new version of Cycles. I don’t know if this is the better place to ask for help, but here it goes…

I’m on the rendering phase of a somewhat heavy project, and decided to try GPU rendering with the latest build of Blender. At least in this project, the gain in rendering time is amazing.
I’m rendering on two computers. One is a dual 8 core Xeon E5-2670, with 64GB of RAM. The other is a dual 6 core Xeon X5670, with 168GB of RAM. The graphics card is the same on both of them, a GTX 1060 with 6GB, and both have the same Windows 10 version, with the same Nvidia driver version installed.

The problem is, on the first computer, it renders fine, but on the second, it doesn’t. The exact same Blender file, starts the rendering process, loads everything to memory, but just when the rendering is about to start, it stops, and outputs this message to the console:

Invalid value in cuMemcpyHtoD_v2(mem, host, size) (C:\Users\blender\git\blender-vdev\blender.git\intern\cycles\device\cuda\device_impl.cpp:906)
Invalid handle in cuModuleGetGlobal_v2(&mem, &bytes, cuModule, name) (C:\Users\blender\git\blender-vdev\blender.git\intern\cycles\device\cuda\device_impl.cpp:904)
Invalid value in cuMemcpyHtoD_v2(mem, host, size) (C:\Users\blender\git\blender-vdev\blender.git\intern\cycles\device\cuda\device_impl.cpp:906)
Error: Invalid handle in cuModuleGetGlobal_v2(&mem, &bytes, cuModule, name) (C:\Users\blender\git\blender-vdev\blender.git\intern\cycles\device\cuda\device_impl.cpp:904)

Is anyone else having this issue? Do you guys have any idea what may be causing the problem, and how to solve it. I’ve tried everything I can remember, but now I’m out of ideas…

Thanks so much

Hey everyone! We have been using Cycles X on a project, and I just noticed that some of the denoising passes have dissapeared from the render layers, namely the Denoising Depth pass. I am wondering if this was removed with the removal of NLM. While we use OIDN for denoising, the denoising depth pass was very useful for our compositing atmosphere/mist/fog setups, because it was antialiased and worked great with transparent/glass/refractive materials in combination with the final denoised image.

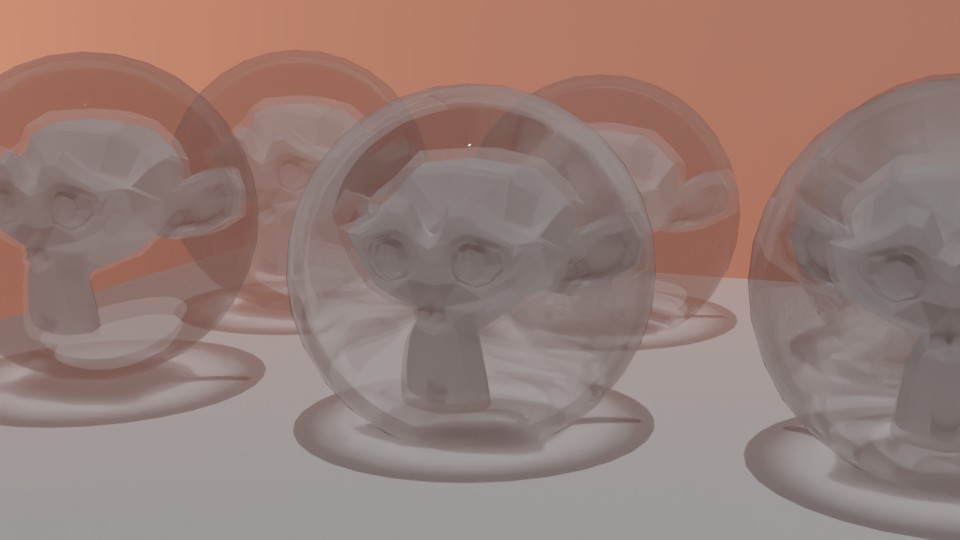
Here is an example with a scene of Suzannes with Glass Spheres:
The final render:

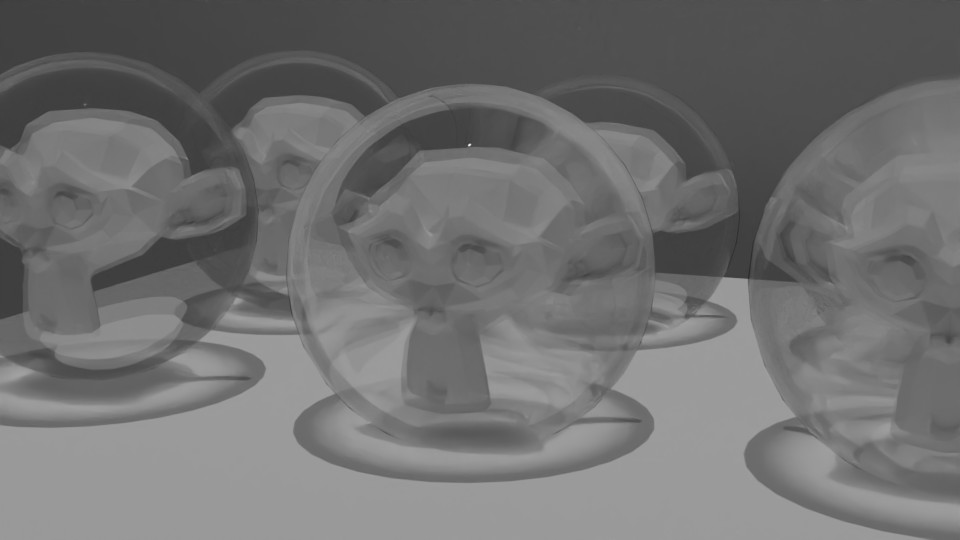
The glass spheres’ material is a simple glass shader mixed with a transparency node.

Here is what the normalized depth pass looks like:


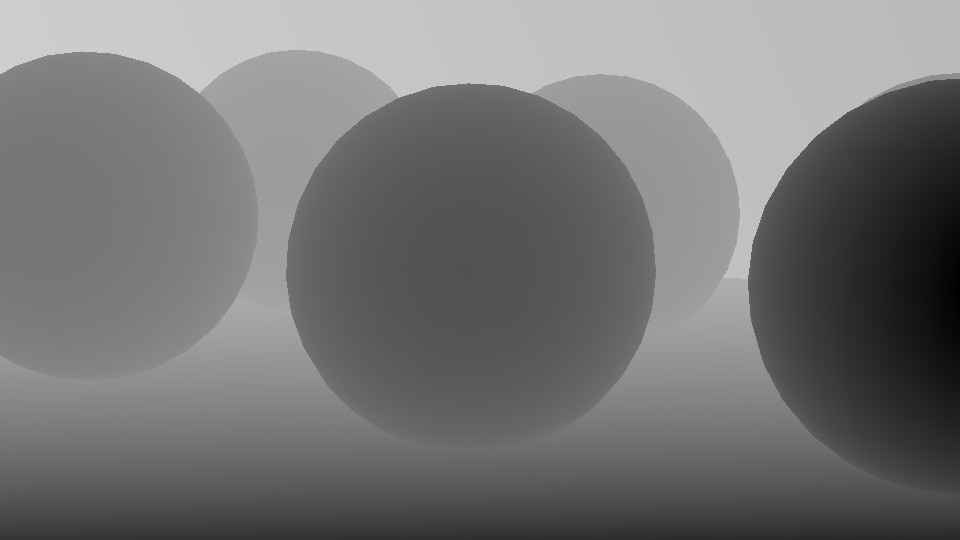
As expected, it doesn’t take into account transparency or refraction

Here is what the mist pass looks like:


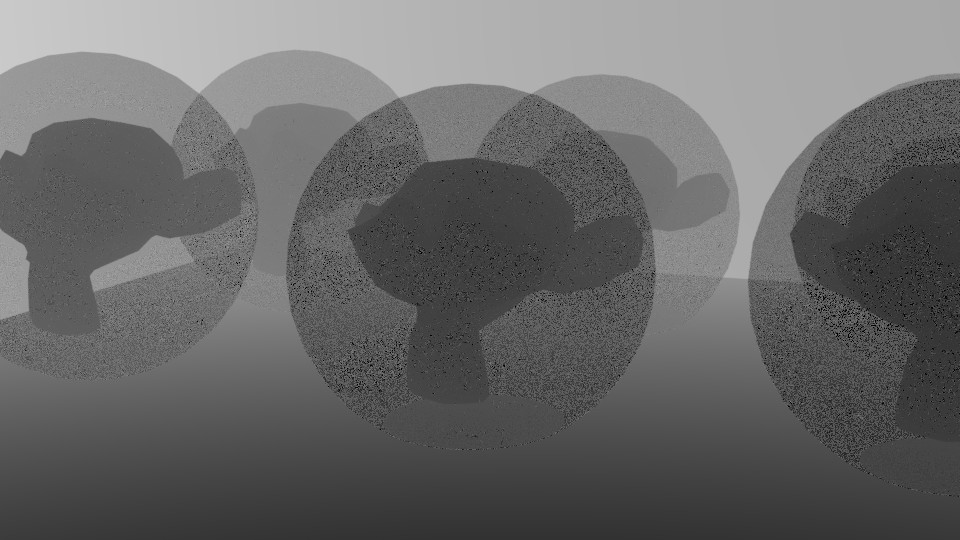
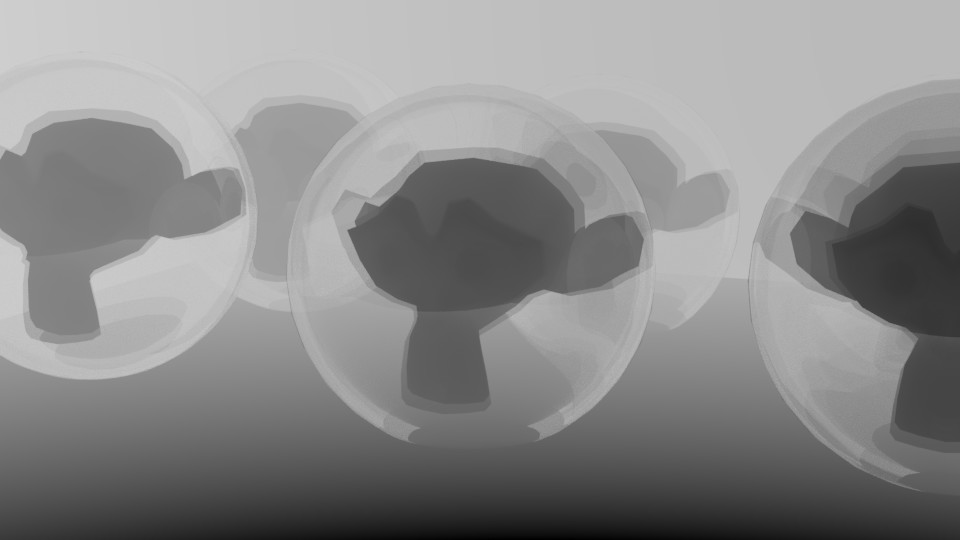
It takes into account transparency, but not refraction, which can cause problems when compositing the mist effect on the final image. It is also noisy, but can be denoised:

It looks better, takes into account transparency, but still no refraction.

Here is the fabled denoising depth pass(normalized):


It is by far the cleanest one of the bunch, is anti-aliased, and most importantly, not only does it take into account transparency, but refraction as well. This is incredibly important for compositing, as the mist/fog effect applied in the background is refracted accurately on the glass object, and is composited in. Here is what I mean.

Here is a fog effect applied using the normalized depth pass:


The front spheres have no transparency information, and as such do not handle the colored fog accurately.

Here is a fog effect applied using the denoised mist pass:


While this one handles tranparency better, the refraction inside the ball is ignored and causes colored halos, and the refracted mist does not have its accurate color.

And finally, here is a fog effect applied using the denoising depth pass:


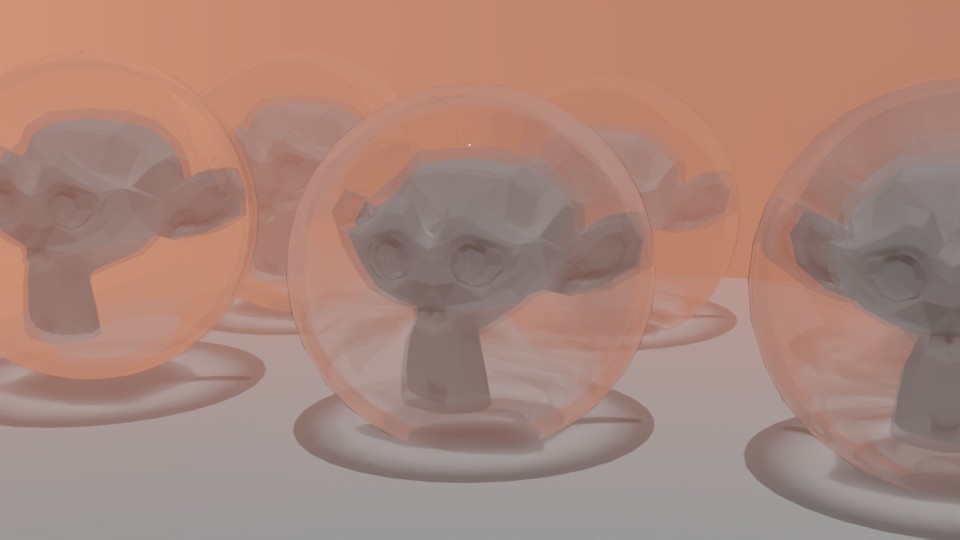
While at first glance the effect seems strong, it is actually the most “realistic” or desired of the bunch: transparency is taken into account, and the mist in the background is accurately refracted in the glass. All our fog compositing relied on the denoising depth pass, and now that it’s gone it is proving incredibly hard to accurately and easy composite fog on scenes having a lot of glass and refractive/transparent materials.

TL/DR:

The denoising depth pass was incredibly useful, can we have it back? And if not, is there any viable alternative to it right now or a node set up to simulate it?

Thank you for all your incredible work on Cycles!

10 Likes

A shot in the dark here but is the GPU overclocked? I’ve just spent several days diagnosing a similar Cycles crash error (ticket T91729) and it seems that MSI Afterburner upping the core clock speed was causing the problem in my case.

Thanks for the answer, but unfortunately this is not the case. There is No overclocking on the GPU, and no MSI Afterburner installed

Have you reported a bug for this? If not please add one.

1 Like

Can you report this as a bug? In case you didn’t you just go to the help menu and select report bug. There are bugs will a similar issue but not quite the same. If you had a sample blend file that would be great also. Which GPU option are you using CUDA or Optix? The more details the better.

1 Like

Thanks, I will report it. I’m using CUDA

I’m not sure if volumetrics is still an incomplete feature in new Cycles. Just in case here’s a simple example where render result in 3.0 is noisy than 2.9:
https://pasteall.org/blend/e4532ac77f9e4285b57d93f0e4fa1c20

Not sure if it’s me, but with the latest two releases, switching from view port shading rendered, to solid, causes Blender to close

blender-3.0.0-alpha+master.26dac33ce18f-windows.amd64-release
blender-3.0.0-alpha+master.439c9b0b8478-windows.amd64-release

If it helps, here’s part of the log (I can post the full log if needed)

backtrace
Exception Record:

ExceptionCode         : EXCEPTION_ACCESS_VIOLATION
Exception Address     : 0x00007FFA9BAA14D3
Exception Module      : VCRUNTIME140.dll
Exception Flags       : 0x00000000
Exception Parameters  : 0x2
	Parameters[0] : 0x0000000000000001
	Parameters[1] : 0x000001D8AB2D6000


Stack trace:
VCRUNTIME140.dll    :0x00007FFA9BAA12F0  memcpy
blender.exe         :0x00007FF6358B3EE0  ccl::PathTraceDisplay::copy_pixels_to_texture
blender.exe         :0x00007FF6358BCC20  ccl::PathTraceWorkGPU::copy_to_display_naive
blender.exe         :0x00007FF6358BC960  ccl::PathTraceWorkGPU::copy_to_display
blender.exe         :0x00007FF6358ADD80  ccl::PathTrace::update_display
blender.exe         :0x00007FF6358AD170  ccl::PathTrace::render_pipeline
blender.exe         :0x00007FF6358AD0B0  ccl::PathTrace::render
blender.exe         :0x00007FF635754C60  ccl::Session::run_main_render_loop
blender.exe         :0x00007FF635754890  ccl::Session::run
blender.exe         :0x00007FF6387591C0  ccl::thread::run
blender.exe         :0x00007FF6351A8F90  std::thread::_Invoke<std::tuple<void * __ptr64 (__cdecl*)(void * __ptr64),ccl::thread * __ptr64>,0,
ucrtbase.dll        :0x00007FFAA0FC1B20  configthreadlocale
KERNEL32.DLL        :0x00007FFAA1867020  BaseThreadInitThunk
ntdll.dll           :0x00007FFAA30A2630  RtlUserThreadStart

Hi, I cant verify on Linux with build: October 07, 02:17:56 - master - 439c9b0b8478
I will test on Windows and edit here.
EDIT:
No crash on: 3.0.0 Alpha, branch: master, commit date: 2021-10-04 07:43, hash: 8c55333a8e80, type: release
build date: 2021-10-04, 08:23:56

Maybe you check from CMD with --factory-startup switch.

Cheers, mib

Thanks for checking @mib2berlin

I see you tested the build from October 4th.
The builds until Oct 5 work fine on my end as well, the issue is happening only on the latest two builds that I mentioned above (Oct 6, and 7):
blender-3.0.0-alpha+master.26dac33ce18f-windows.amd64-release
blender-3.0.0-alpha+master.439c9b0b8478-windows.amd64-release

I also tried with the default factory settings, and the issue is still happening.

Yes I see that it is noisier.


The first image is with 2.9 and 3.0. I don’t think it is a bug it may be some differences in the path tracing algorithm. However, it would be good to log is as a bug so that it gets looked into.

1 Like

You should use blender to report this as a bug. That way we get all your details.

Hi, I tested now with
3.0.0 Alpha, branch: master, commit date: 2021-10-06 22:38
hash: 439c9b0b8478, type: release
build date: 2021-10-07, 00:04:42

I render default scene on CPU, GPU, CPU+GPU, Cuda and Optix in the viewport and switch back and forth solid and render.
I5, RTX 2060.

No crash.

You can report it to the bug tracker, maybe a developer can reproduce.
Create info text file from Help menu and past it to the report.
If you start the report from the Help menu Blender fills many information automatically to the report form.

Cheers, mib

I think it’s actually an issue with CPU rendering in 2.93. If you compare cpu and gpu rendering there, cpu is much cleaner. But on 3.0 both devices produce identical results, and noise level is similar to gpu rendering in 2.93. Also it’s more than 2x faster.

Now that you mention this, I think I remember that volumetrics on GPU had some limitations compared to CPU. Even the .blend file of this old report of mine still gives problems with hybrid GPU+CPU render in 2.93 and 3.0 (Black tiles in 2.93 and Black bands in 3.0)

https://developer.blender.org/T52013

and now I see where the node configuration I was using came from