Cycles has a feature where it can breakout where processing time is being spent.
This can be done by opening Blender from the command line with the launch arguments:
--debug-cycles --verbose 4
For example:
/path/to/blender --debug-cycles --verbose 4
If you then render an image, at the end you will get some stats printed in the terminal about the render and where processing was spent. These stats look like this:
I0509 12:22:47.046001 34484 session.cpp:464] Total render time: 6.07198
I0509 12:22:47.046001 34484 session.cpp:465] Render time (without synchronization): 5.43004
I0509 12:22:47.095000 34484 queue.cpp:39] GPU queue stats:
I0509 12:22:47.095000 34484 queue.cpp:43]      1.03760s: integrator_shade_surface integrator_sorted_paths_array prefix_sum
I0509 12:22:47.095000 34484 queue.cpp:43]      0.96824s: integrator_intersect_closest
I0509 12:22:47.095000 34484 queue.cpp:43]      0.66656s: integrator_shade_background integrator_queued_paths_array
I0509 12:22:47.095000 34484 queue.cpp:43]      0.65319s: integrator_shade_background
I0509 12:22:47.095000 34484 queue.cpp:43]      0.44145s: integrator_init_from_camera
I0509 12:22:47.095000 34484 queue.cpp:43]      0.39213s: integrator_intersect_closest integrator_queued_paths_array
I0509 12:22:47.095000 34484 queue.cpp:43]      0.30637s: integrator_init_from_camera integrator_compact_states
I0509 12:22:47.095000 34484 queue.cpp:43]      0.28085s: integrator_intersect_shadow
I0509 12:22:47.095000 34484 queue.cpp:43]      0.20484s: integrator_terminated_paths_array integrator_compact_paths_array
I0509 12:22:47.095000 34484 queue.cpp:43]      0.11728s: film_convert_combined_half_rgba
I0509 12:22:47.095000 34484 queue.cpp:43]      0.11277s: integrator_shade_light integrator_queued_paths_array
I0509 12:22:47.095000 34484 queue.cpp:43]      0.09890s: integrator_shade_shadow
I0509 12:22:47.096000 34484 queue.cpp:43]      0.05114s: integrator_shade_shadow integrator_queued_shadow_paths_array
I0509 12:22:47.096000 34484 queue.cpp:43]      0.01223s: integrator_terminated_shadow_paths_array integrator_compact_shadow_paths_array
I0509 12:22:47.096000 34484 queue.cpp:43]      0.01203s: integrator_init_from_camera integrator_reset
I0509 12:22:47.096000 34484 queue.cpp:43]      0.00167s: integrator_shade_surface integrator_sorted_paths_array integrator_compact_shadow_states prefix_sum
I0509 12:22:47.096000 34484 queue.cpp:43]      0.00119s: integrator_intersect_shadow integrator_queued_shadow_paths_array
Based on these stats, you can see that integrator_shade_surface is taking up the largest amount of processing time in this scene.
Note: These states are sorted in order of most processing time to least processing time.
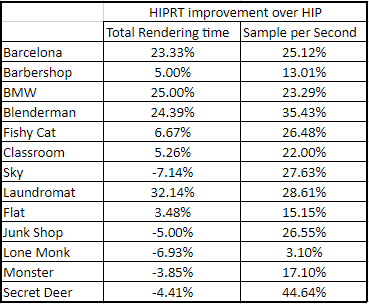
What you can do with this information is you can compare HIP to HIP-RT and see how they differ (most of the difference will be with intersection kernels). With this information you can actually figure out the “speed boost” the RT accelerators offer over just doing ray tracing on the general purpose compute cores.
Along with that you can compare CUDA to OptiX and see how they differ (once again, most of the difference will be with intersection kernels).
And lastly you can compare the relative distribution of work between various parts of the render between AMD and Nvidia with various architectures. (E.G. 20% of work is spent in X feature on Y GPU, while Z GPU only spent 10%) Allowing you to pick out things and come to conclusions like “GPU X from Manufacture A seems to have a hard time rendering sub-surface scattering materials when compared to GPU Y from Manufacture B in THIS SPECIFIC SCENE”
AMD and Nvidia have different GPU architectures, cache layouts, memory speeds, ray accelerator designs, BVH layouts when using OptiX and HIP-RT, and more. There’s a lot that’s different between them. They have their own strengths and weaknesses, and it may not be as simple as “X material always renders faster on AMD”. It may be more complex and situational.
It may even be hard for AMD to get close to showing the same benefits with HIP-RT as Nvidia shows with OptiX with current generation hardware due to major hardware differences. But this is just speculation.