No action is required on My Data. The My Data portal exists so that you can manage (for now it simply means “delete”) the benchmarks you submitted. Once you submit a benchmarks it’s automatically sent to Open Data.
These are all very good points! Most of them are already tasks on the workboard.
Not yet, but we will make the complete data set available for download later this week.
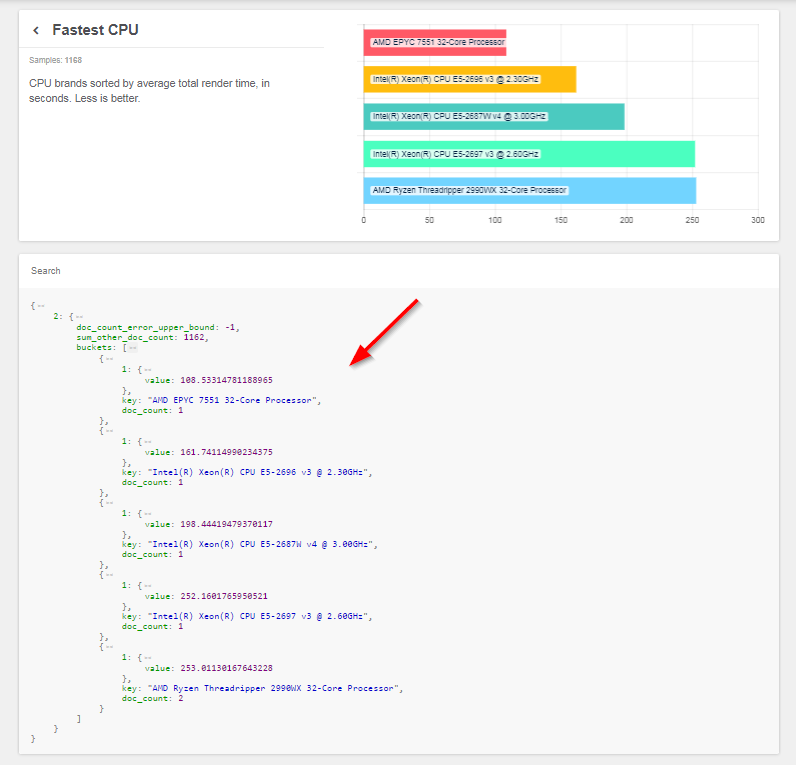
The “Fastest CPU” plot seems to mix Quick and Complete test runs, which makes it unreliable. If my observation is correct, the quick run contains a quick scene and a regular scene (in my case, ~1 min + ~2,5 min). The complete run has various scenes that take ~2,25 min on average.
With the Quick run my CPU looks much better than with the Complete run. Likewise, if I submit my Complete run, it looks inexplicably bad in comparison to the other contenders which I assume were Quick runs.
Does this make sense?
What sort of issues should we report there, versus here? Is this thread more for general feedback, while that one is for actual technical issues / bugs / errors? Or is it something else?
Also, when running this benchmark in CPU mode, does the GPU play any role? I ask because I just tested the same CPU with different video cards installed (GTX 1080 Ti and RX Vega 64) and with the GeForce card the render times were 2-5% shorted (faster) than with the Radeon. I was not expecting that, and other rendering tests (Cinebench, V-Ray) showed no significant difference.
Internet Explorer 11 was released on October 2013.
Could you please try with a more recent browser?
1 Like
This thread is focused on feedback, while we prefer to keep issues on d.b.o.
About GPU influence on CPU, this should not have any effect. If you could please report this on the issue tracker (with some info about your setup) we will investigate.
1 Like
Hi, I use IE11 because of company policy.
Chrome works, although the detail pages don’t show anything at the bottom underneath “Search”, just a script.
1 Like
Got an error when trying to share my results that the the server couldn’t be reached for some reason… I couldn’t read the whole error message as it was wrapped within the small error pop-up.
Hi, Martin here from GarageFarm.NET.
First of all, thank you for developing this benchmark. We were waiting for such a tool for Blender, as it was not easy to compare different setups before.
I noticed that there’s no cli support yet, and unfortunately, our CPU only based nodes do not support OpenGL 3.3, so had to dig a bit to run the benchmark on such setup. The solution was to use mesa3d to emulate OpenGL, and on latest version, it worked fine.
Next, I came across this bug: https://developer.blender.org/T56443, but fortunately, was able to go over it.
I have a question about the general benchmark logic. I have tested a setup with 4 CPU - E5-4669v4, 88 cores, 176 threads. In the benchmark log, I noticed that the tool detected only a single socket. During the render on 176 threads were used which is great, but I am not sure about the score. Is it calculated per single CPU?
I noticed that after my test our benchmark appeared on 2nd place on the list of the Fastest CPU after Epyc 7551. If it is calculated per single CPU then it seems to be right, but if it is per the whole server - 4CPU then it seems to be too low. The benchmark time was 14:16 on the first run and 14:30 on the second run.
I am wondering if the performance lowered by some factors like using the MesaGL or operating system Windows 10 as opposed to Linux.
Hi,
After testing Beta 1 on real mac (MacBook 2011 & IMac 2017) I just tested Beta 2 on my Hackintosh (i7, GTX950 OSX 10.12.6, CUDA & Nvidia drivers up to date).
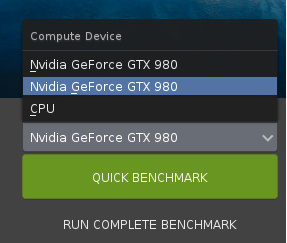
I have only One GTX 950 and I was surprised to see Two in compute devices next to the CPU. It’s only after reading the error report tha I saw one of the 2 GTX was OpenCL and the other was CUDA.
In the Compute Device list should tell that one is OpenCL and the other is CUDA. One just crashed when the other worked fine.
At the end, still not able to upload datas.
Still some token/SSL problems :
“==================== Exception:
requests.exceptions.SSLError: HTTPSConnectionPool(host=‘mydata.blender.org’, port=443): Max retries exceeded with url: /token/verify (Caused by SSLError(“Can’t connect to HTTPS URL because the SSL module is not available.”,))”
1 Like
Hi, Juste ran the benchmark. I’ve two GPUs but it seems I can only select one single carte (see screen shot). Not clear to me if the bench was made with the two cards or only one.
It could be interesting to propose : CPU | Card 1 | Card 2 | Cards 1 & 2 to make things clearer.
1 Like
I just ran the Quick Benchmark and submitted my results for a 1060 6GB. I recommend adding in data on the actual CPU and GPU clock rate. My CPU is marked as an i3-8350K at 4.0 GHz but it’s actually set to 4.4/4.7 (AVX/non-AVX) and with 3000 MHz CAS14 RAM. The GPU is “stock” but is a higher clocked model.
Perhaps the database of a given model could contain an “average” score for the varying clocks? I don’t know if it does now.
1 Like
Hi all. I wonder, is it possible to run the benchmark in the background, without the GUI? I want to run it on a server through terminal.
Are there any command line options? Can I execute the quick test via a simple command? Seems odd to have a benchmark without that option, or any documentation that I can see.
I agree as to keeping the parameters at which the benchmark runs consistent as a level playing field. Those settings need to be the same across the board.
As to overclocking, I don’t think that needs to be there as a “cheating prevention.” Instead, overclocking is part of the game for benchmarks, and those trying to get the best scores do look at benchmarking as a game.
Instead, I recommend doing something to check the frequency of the hardware and measure it against the standard specs of the hardware. The reason why is to create a two tier data presentation: 1) stock scores and performance, and 2) Overclocked scores and performance. The first is so that industry professionals can quickly look through and evaluate hardware selection for use with blender. The second is for the overclocking community to see who can squeeze that last ounce of performance out of the system. They both have their place and purpose. I was actually going to recommend such a filter for stock and overclock, but seeing as you already had great comments and had given thought to it, I wanted to respond here.
But, there is also a need to examine the timer being used by the different platforms. AMD Ryzen and Threadripper platforms, at least in regards to Windows 8 and Windows 10, have an issue of RTC timer drift. This was also found on Intel CPUs older than Skylake. I do not know if such an issue exists on Linux. It occurs with BCLK overclocking, where if you clock BCLK slower, the CPU reads the time faster than it should, whereas when raising BCLK over 100, it reads slower than it should. This can incentivize manipulation by the community, which is something to keep in mind. So, maybe having something in the program to read which timer the system is using (ITSC, RTC, or HPET) may be another data point worth collecting.
Benchmark with no command line options?  All that hard work and in the end still need to click around. Just just let me --gpu --quick --no-upload, that’s all.
The web site results seems to indicate not many people use Blender on OSX, while looking at the various tickets, it seems not many people are able to submit results when using the OSX client (myself included).
While I understand this is beta, this should be addressed quickly, because it is misleading. If a quick fix to the client is not possible, at least a footnote on the benchmark results should be added.
1 Like
We’re also having the MacOS submission issues. Across multiple builds and hardware as well.
1 Like