I think that multiple GPU or hybrid GPU+CPU would complicate things a lot and does not provide much important information to the benchmark. We should keep this as simple as possible in order to obtain accurate and clear information.
What would be the benefit of a point score?
Progress bar works properly on Windows 10 64-Bit. Might be worth a bug report?
For most people a point score has the advantage that higher numbers = higher performance and is easier to visualize and comprehend than lower numbers = higher performance.
Some people would like to know the score for their combined system. The benchmark is already quite complicated. I.e. you can choose between the GPU and CPU and also a Quick and Complete version. It will not make it much more complicated to be able to choose the CPU/GPU combination either. If you want to make it simple you should get rid of the Complete version and provide more and faster render scenes for the Quick version. A 30 minutes benchmark run is too long time for tweaking your computer and running the benchmark multiple times to see the changed result.
2 Likes
This is going to be an amazing resource! Kudos to the dev team for all of their hard work!
Looking at the Open Data website I have a couple of ideas for potential improvement, as well as a couple of feature suggestions.
-
I find the overall statistics to not be especially helpful, when in general, a user is going to be wanting to compare benchmarks for specific pieces of hardware. I think it would be beneficial to have a set of granular filter options at the top of the main page that would allow a user to confine the data to specific data sets, for example:
- The user could select a global option of how many of the top items to include in the graphs that are produced (e.g. top 5, top 10, etc.).
- A filter/search bar could be used that would limit the dataset for the graph to an exclusive set of hardware (e.g. “Ryzen 7 2700; Core i7-7700K” --> AMD Ryzen 7 2700 Eight-Core Processor; Intel® Core™ i7-7700K CPU @ 4.20GHz). Auto-completion or search suggestions for search terms would be also be very helpful. The data visualization on the page would then update to reflect the limited dataset.
- Additional filtering options, such as brand, number of cores/threads, clock speed, etc. could also be added to refine results.
-
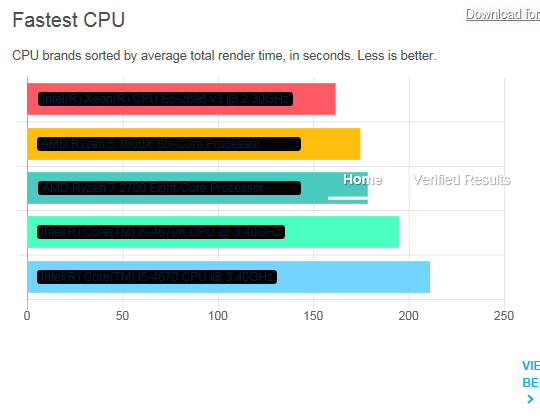
A popover or popup that contains additional, more detailed information about a specific graphical data element would be nice. For example, when mousing over a bar on the graph, a popup would appear that would give you the specific numerical value of the data, number of devices used to calculate that particular value, etc. (e.g. avg 235 seconds, 436 data entries, etc.).
-
A price/unit work calculator of some sort would also be very useful. For example, a user would be able to enter a specific cost for a part (this would be done manually, since computer component prices vary so wildly). This data could then appear in the popups described above, or perhaps it’s own graph.
- It might also be interesting to add an optional average electrical cost that could be used in the calculation as well.
-
Within the dedicated page for each benchmark category, it would also be useful to have more granular options as mentioned above.
- It would also make sense to add additional filter options relevant to the specific benchmark. For example, on the “Render Time per Scene” benchmark page, it would be useful to filter by OS, GPU or CPU (or both?), in addition to the above mentioned options for specific hardware.
-
The search field and raw data below the graph on the dedicated page for each benchmark is not really useful to the average user and could probably be collapsed or hidden behind an “Advanced” rollout so that it is not distracting.
-
I’m sure there are already lots of additional ideas for further benchmarks floating around; here are a couple that I feel would be very useful:
- Benchmarks for scenario specific use cases within Blender:
- Creating a large number of cubes (or monkeys) and applying a subsurf to all of them.
- Opening a very large file.
- Applying a subsurf or multi-resolution to a very dense mesh.
- Toggling edit mode with a very dense mesh.
- Selecting vertices on a very dense mesh.
- Benchmarks for scenario specific use cases within Blender:
I’ll try to add more if I think of anything else. I am super excited to see where this goes!
3 Likes
Another aspect is that a ‘work per unit time’ is also a linear representation of performance. With a time-based reporting system, it all just goes down to zero and it is difficult to see how scaling works with respect to hardware.
Regarding this that I had said. I changed Samples settings in BMW and Classroom scenes and running Benchmark I get super fast render times… I have not clicked Share Online just in case.
Please, we have here involved powerful interested hardware companies that compete wildly, and a couple of fanboys users. You do everything possible for cheats prevention. You would run a checksum for all the configuration files and scenes, not only when you start the program, but when config files/scenes are loaded/required by the program while the benchmark is running. We need reliable/trusted results
Edit:
This is what I use in Linux to get the correct frequency for which my intel i7-3770 is running:
cpufreq-info / cpuinfo does not show the real turbo or overclocked frequency which is running for intel processors. But i7z has not been updated for a long time and I’m not sure if it still works for new intel families.
pretty cool to see a official benchmark!
what i would also like to see added at some point is some sort of realtime viewport benchmark.
that might also help to see performance for modeling (maybe one eevee and one openGL) which can be quite different to what performs the best in offline rendering in my experience.
1 Like
HI is there an api endpoint to get the current data
The Blender Benchmark opens on MacOS Mojave but when running either the quick or full benchmark it causes my MacBook Pro with external ASUS Strix Vega 64 GPU to lock up (freeze) then shut down. When running the benchmark selecting the CPU it runs the full test without crashing.
The benchmark crashed during the GPU test. A message then pops up saying I can still record the successes. Not much of a benchmark if it ignores the failures. Statistics are only valid when all data is incorporated.
Crashes after a while, when switching to Nvidia GeForce GT 710 Compute Device, CPU computing runs ok.
I have the same request for Linux.
It would be nice to have command line options available to run the benchmark on headless servers.
We’ve just received a couple of 64-threads Xeon servers, and I’m sure these beasts would love to test the Blender benchmark 
1 Like
I am getting the same problem on a Windows 10 64bit PC. No buttons to choose CPU/GPU or to start the benchmark. It works an another system, with Windows 7.
Also, on the website, the names of the CPUs/GPUs are greyed out in Internet Explorer 11:
Hi,
Same here on Sierra.
With either Safari or Firefox as browser.
It’s with the quick test. Full test not tested.
Do you plan to support headless systems? I would like to run the benchmark on my server but it does not work without X11.
2 Likes
The benchmark seems to work for me, but I had some questions about the tests it involves.
From what I can tell, these are all rendering tests - which is a factor in Blender’s overall performance, certainly, but it only covers a part of what this software is used for. Is there any way that future versions of the benchmark could also cover 3D modeling, animation, simulations (of various kinds), etc? Some of that can be really hard on computers, but also requires very different specs than rendering for good performance.
2 Likes
Actually, now that I am trying this on different hardware, I am encountering some issues. When testing the CPU, on both AMD (Threadripper 2990WX) and Intel (Core i9 7980XE) all tests finish - but when testing the GPU (NVIDIA GeForce GTX 1080 Ti) it results in a crash on the barbershop_interior test. This happens on both CPUs / platforms, with that video card. The other five tests all finish okay.
Thanks for the suggestion! You can track the progress of this task on developer.blender.org.
Thanks for trying thing out! Please report Benchmark Client issues on https://developer.blender.org/maniphest/task/edit/form/7/
This is also a suggestion for @Markus @MartinSanchez-3 @piersyf @Rajwanshi