Thanks for the feedback. What you see under the chart is the “raw data”, the actual results for a query on the current dataset. I created a task to improve the presentation of such data.
Could you download the latest version of the benchmark and try again? Error reporting should be better now.
Hello Martin,
Next week we will look into the issue you reported and continue the conversation there. I am not sure about single vs multicore performance. As far as I know, if Blender is set to “CPU” it uses all cores.
Many factors can influence the performance of a benchmark (and indeed OS is one of them).
Regarding CLI rendering, it’s on the roadmap.
Thanks for the feedback. Could you please report any technical issue on developer.blender.org?
The current idea for this benchmark is to be able to compare individual device performance. In the future we might support multiple devices, but it’s not yet clear how useful this kind of data will be.
Thanks for the feedback! I guess this depends on the library used to detect the actual CPU. Could you please report the issue on developer.blender.org?
Not yet. We definitely plan to offer this feature.
Hi Franck. If you are having a technical issue submitting the data using the latest benchmark build, could you please report it on developer.blender.org?
Hi Fsiddi,
It has been reported for a while: https://developer.blender.org/T56329
If a fix cannot be made quickly, then a notice on the website that reports the data should be indicating, that there are issues to report against OSX and this is why the numbers are low. This would be fair.
Ok, thanks for the report. We will give you an update this week.
Hi Francesco!
Any news for “Combined Compute Device” support? it will be very useful and interesting.
1 Like
i assume the issue has already be reported that the benchmark is not able to run? when i open the interface i can not choose any option nor start the benchmark. all that happens is that the options wobble when the mouse hovers over them.
is there a workaround for this?
im running windows 10 with a intel cpu and a amd gpu if that might be related to this behavior.
I receive a timeout error when I try to post. Also, 2080ti will not run in short or long test.
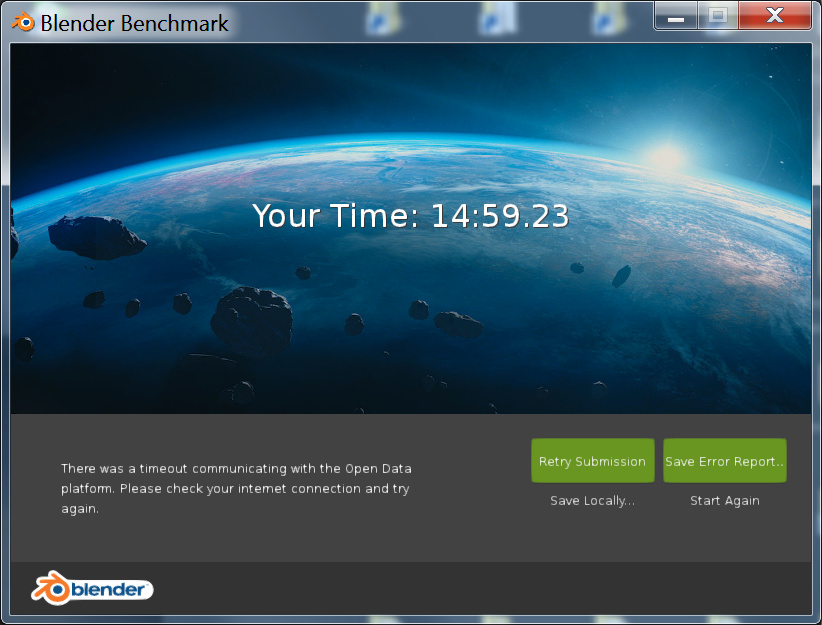
error report:
==================== Benchmark Client
version: 1.0b2
current time: 2018-11-03T17:10:25.486778+01:00
==================== Exception:
requests.exceptions.ReadTimeout: HTTPSConnectionPool(host=‘mydata.blender.org’, port=443): Read timed out. (read timeout=30)
==================== State:
{‘State’: <enum ‘State’>,
‘background_image_path’: ‘’,
‘cached_compute_devices’: [(‘CPU:::’, ‘CPU’, ‘’),
(‘CUDA:GeForce RTX 2080 Ti::0’, ‘Nvidia GeForce RTX 2080 Ti’, ‘’),
(‘CUDA:TITAN X (Pascal)::0’, ‘Nvidia TITAN X (Pascal)’, ‘’)],
‘cached_system_info’: {‘bitness’: ‘64bit’,
‘cpu_brand’: ‘Intel(R) Xeon(R) CPU E5-2696 v3 @ 2.30GHz’,
‘devices’: [{‘name’: ‘Intel Xeon CPU E5-2696 v3 @ 2.30GHz’, ‘type’: ‘CPU’},
{‘name’: ‘GeForce RTX 2080 Ti’, ‘type’: ‘CUDA’},
{‘name’: ‘TITAN X (Pascal)’, ‘type’: ‘CUDA’}],
‘machine’: ‘AMD64’,
‘num_cpu_cores’: 18,
‘num_cpu_sockets’: 1,
‘num_cpu_threads’: 36,
‘system’: ‘Windows’},
‘cancel’: False,
‘current_progress’: 0.0,
‘images’: {‘F:\mattmedia\programs_m\blender\blender-benchmark-1.0b2-windows64\2.80\scripts\benchmark\benchmark\space\blender.png’: bpy.data.images[‘blender.png’],
‘F:\mattmedia\programs_m\blender\blender-benchmark-1.0b2-windows64\2.80\scripts\benchmark\benchmark\space\splash.png’: bpy.data.images[‘splash.png’],
‘F:\mattmedia\programs_m\blender\blender-benchmark-1.0b2-windows64\scenes\bmw27\bmw27.png’: bpy.data.images[‘bmw27.png’],
‘F:\mattmedia\programs_m\blender\blender-benchmark-1.0b2-windows64\scenes\classroom\classroom.png’: bpy.data.images[‘classroom.png’]},
‘progress_lock’: <locked _thread.lock object at 0x000000000BFBAF58>,
‘progress_status’: ‘’,
‘reset’: <classmethod object at 0x000000000C034320>,
‘result_dict’: {‘benchmark_client’: {‘client_version’: ‘1.0b2’},
‘blender_version’: {‘build_commit_date’: ‘2018-03-22’,
‘build_commit_time’: ‘14:10’,
‘build_date’: ‘2018-03-22’,
‘build_hash’: ‘f4dc9f9d68b’,
‘build_time’: ‘09:59 AM’,
‘version’: ‘2.79 (sub 0)’},
‘device_info’: {‘compute_devices’: [‘Intel Xeon CPU E5-2696 v3 @ 2.30GHz’],
‘device_type’: ‘CPU’,
‘num_cpu_threads’: 36},
‘scenes’: [{‘name’: ‘bmw27’,
‘stats’: {‘device_memory_usage’: 140.86,
‘device_peak_memory’: 140.87,
‘pipeline_render_time’: 209.89,
‘render_time_no_sync’: 205.048,
‘result’: ‘OK’,
‘total_render_time’: 208.099}},
{‘name’: ‘classroom’,
‘stats’: {‘device_memory_usage’: 297.34,
‘device_peak_memory’: 297.39,
‘pipeline_render_time’: 692.28,
‘render_time_no_sync’: 688.762,
‘result’: ‘OK’,
‘total_render_time’: 691.135}}],
‘system_info’: {‘bitness’: ‘64bit’,
‘cpu_brand’: ‘Intel(R) Xeon(R) CPU E5-2696 v3 @ 2.30GHz’,
‘devices’: [{‘name’: ‘Intel Xeon CPU E5-2696 v3 @ 2.30GHz’, ‘type’: ‘CPU’},
{‘name’: ‘GeForce RTX 2080 Ti’, ‘type’: ‘CUDA’},
{‘name’: ‘TITAN X (Pascal)’, ‘type’: ‘CUDA’}],
‘machine’: ‘AMD64’,
‘num_cpu_cores’: 18,
‘num_cpu_sockets’: 1,
‘num_cpu_threads’: 36,
‘system’: ‘Windows’},
‘timestamp’: ‘2018-11-03T15:41:30.529544+00:00’},
‘result_platform’: ‘OS: Windows 64bit\n’
‘CPU: Intel Xeon CPU E5-2696 v3 @ 2.30GHz\n’
‘GPUs:\n’
’ • Nvidia GeForce RTX 2080 Ti\n’
’ • Nvidia TITAN X (Pascal)',
‘result_stats’: ‘bmw27: 03:28.10\nclassroom: 11:31.13’,
‘results_submitted’: False,
‘results_url’: ‘’,
‘scene_status’: {‘bmw27’: ‘03:28.10’, ‘classroom’: ‘11:31.13’},
‘state’: <State.complete: 3>,
‘submission_exception’: ReadTimeout(ReadTimeoutError(“HTTPSConnectionPool(host=‘mydata.blender.org’, port=443): Read timed out. (read timeout=30)”,),)}
Why can we see only the five fastest devices ?
Good thing about such benchmark is to have a variety of results for a large spectrum of different devices. Allowing you to know where each device stands among others, you can i.e. see what’s the theorical value of your setup, or try to deduce what you should buy for your next upgrade, etc…
But with only the five best, most people just can’t do anything with such data.
4 Likes
Barbershop interior crashing in my system too.
Trying to submit the complete GPU test i got an error.
Internal Server Error
Oops, we made a mistake somewhere.
Try the front page instead.
If you need assistance, you may reference this error as c83f9e749df147c3a16a4f3f6d5ce5bf .
Would be nice to have a choice, of what benchmarks made be rendered and information about, what tile sizes are used for CPU and GPU renderings.
If this isnt the right place, could you please point me in the right direction.
Do you know why specifically for the AMD Radeon Pro WX 7100 Graphics there are entries where the result is marked OK (not CRASH) but the average memory is 0MBs?
The 16GB of memory on that card gets split between the two GPU’s on it, so that might cause the problem perhaps, beyond that I have no clue.
average memory of 0MBs ? how is that even possible ? even a 4px² render of the startup scene takes 9MB.