Hi! I’m very new here. I’ve been communicating with a couple of devs on blender.chat, but figured it might be a good idea to create a topic for it on the developer forums as well.
problem:
I (and I think many people with me) have been looking for a way to visualize values generated with geometry nodes. The viewer node is great, but in the original commit it’s already stated that there are some limitations in regards to visualising values greater than 1, or smaller than 0.
proposal:
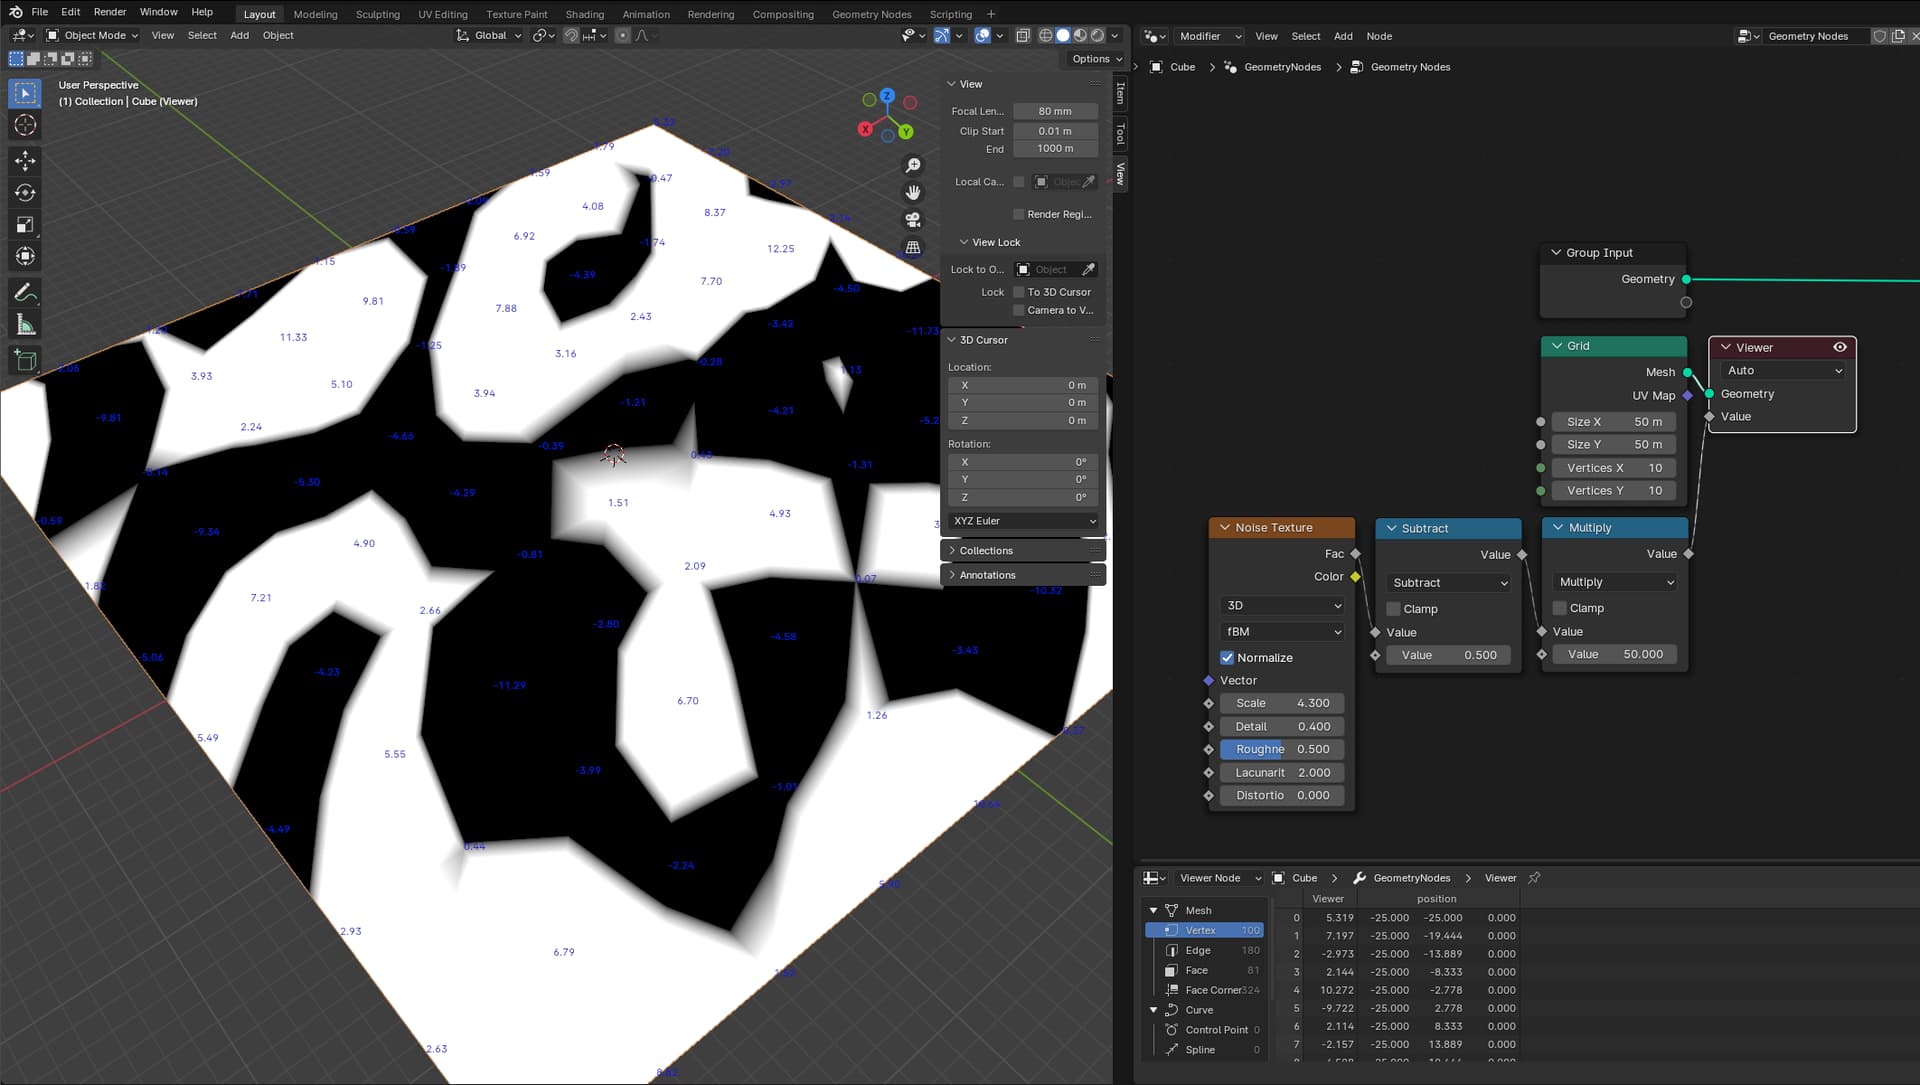
I took some inspiration from how Houdini treats visualising attributes, and hacked together a way to show geometry node values in the viewport as text. Because the Viewer node has a lot of QoL features (e.g. quick connect), I figured extending the existing viewer node would be a great place to implement this feature.
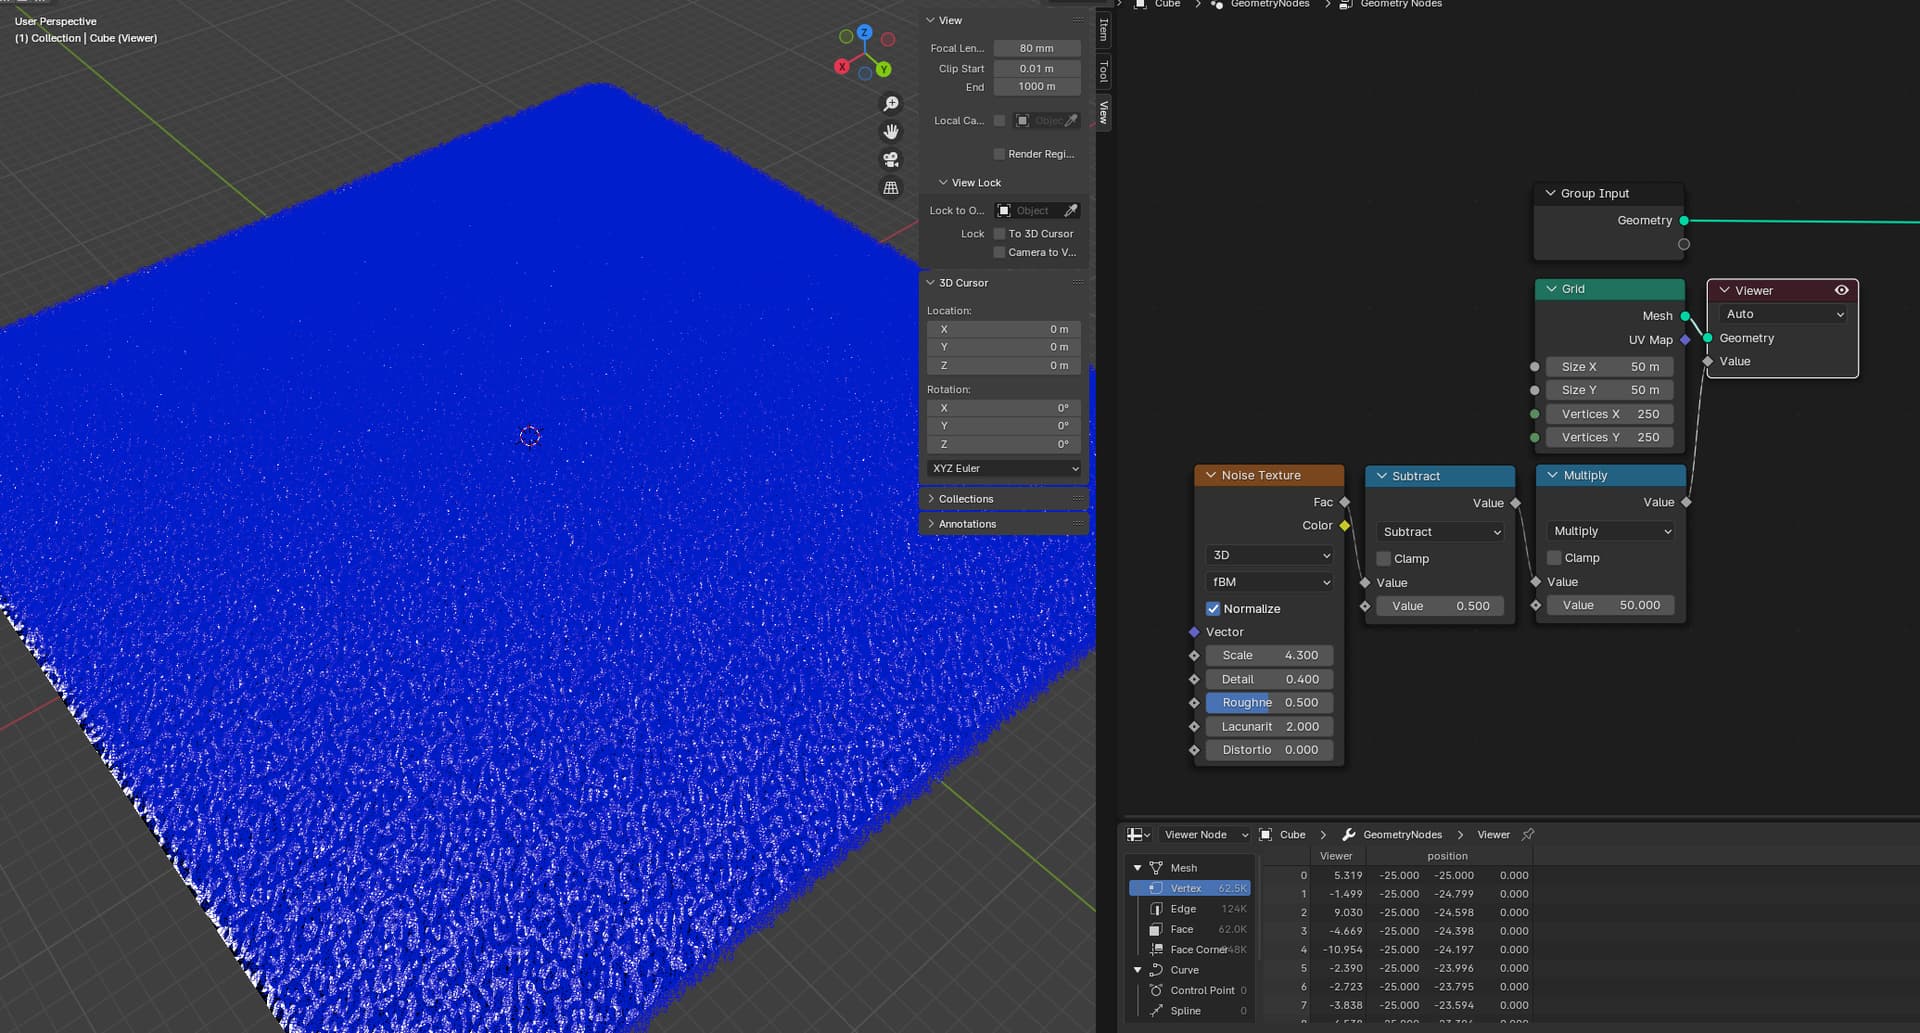
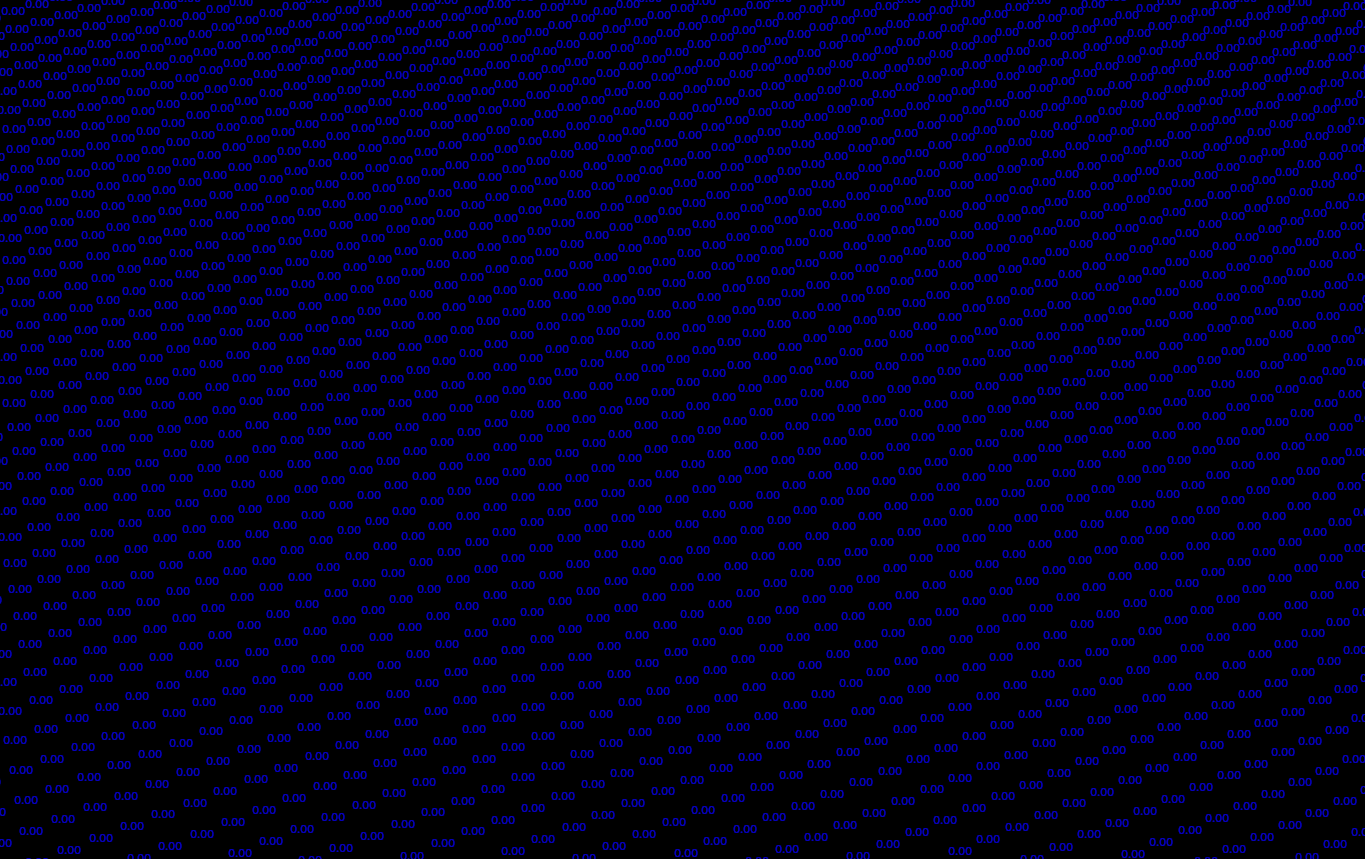
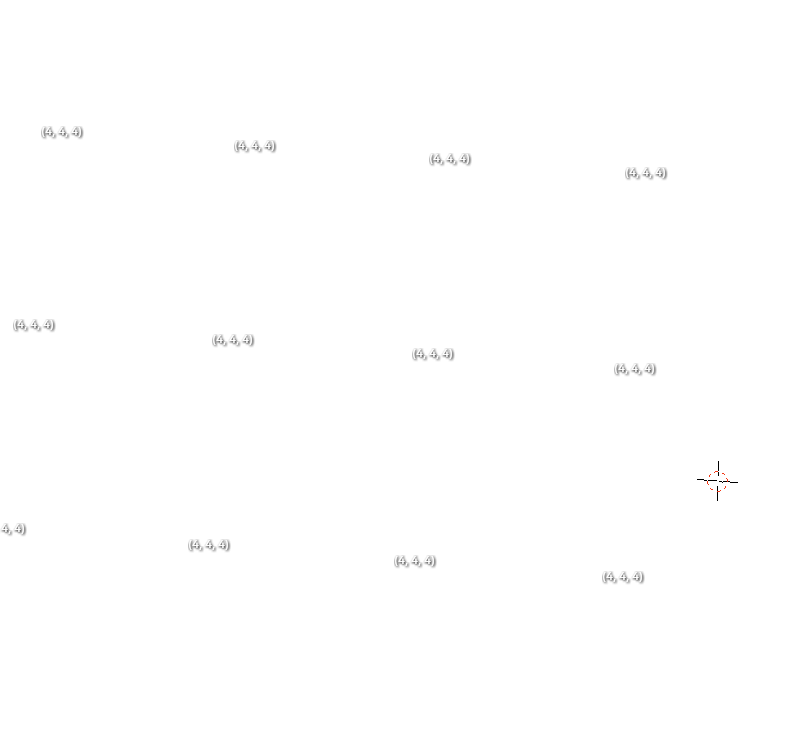
Limiting vertices: Right now, adding 500k vertices to the text cache is fast, taking about 0.01s. Rendering these values at high density (with a lot of overlapping geometry) takes a lot longer though. Visualising a high density of text causes severe dips in frame rate in the viewport. Furthermore, superseding the performance issues is the complete lack of readability:
would it be a good idea to limit how many text is being rendered at the screen? Is there currently a way to ensure that values will be shown in low density situations? (e.g. zooming in and framing a couple of vertices of a 500k vert grid).
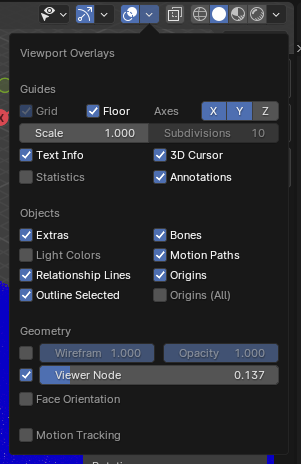
Enable/disable text: I think it would be nice to have the ability to show and hide the text in an intuitive manner. Right now the overlay viewer has an opacity slider, would it be an idea to add a button here that toggles the text?
Contributing to blender is something I have never done before, so I humbly ask for some opinions/guidance on the following roadblocks I’m running into, with the goal to contribute .
When you have thousands of vertices and you’re zoomed out, wouldn’t it make more sense if Viewer node displayed averaged value of some regions, instead of individual values for limited amounts of vertices? It would give more information. It can be zoom dependant, when you zoom in on individual vertices show individual values, when you zoom out show average value for the region. That can be very informative
While that would be very nice I guess it would be very hard to do in a performant way. Because that would mean you would not only need to draw stuff, but also calculate it.
I think I’d aim for either:
draw every xth value, maybe based on the 2d location in the viewport if that information is available.
I don’t think average values is relevant information in most cases.
I think that if two values are too close to each other, it should just display the closer one.
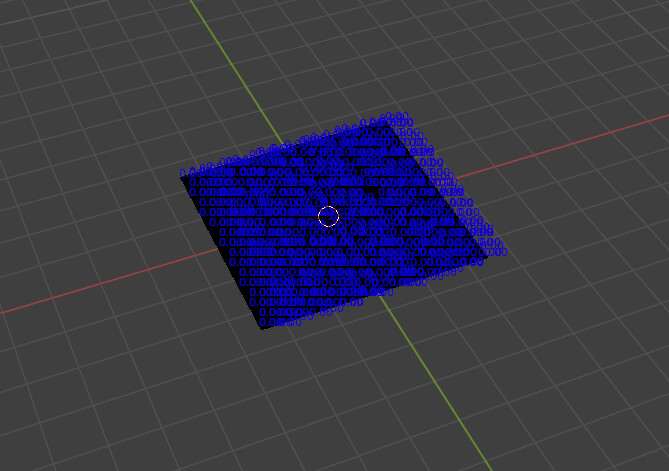
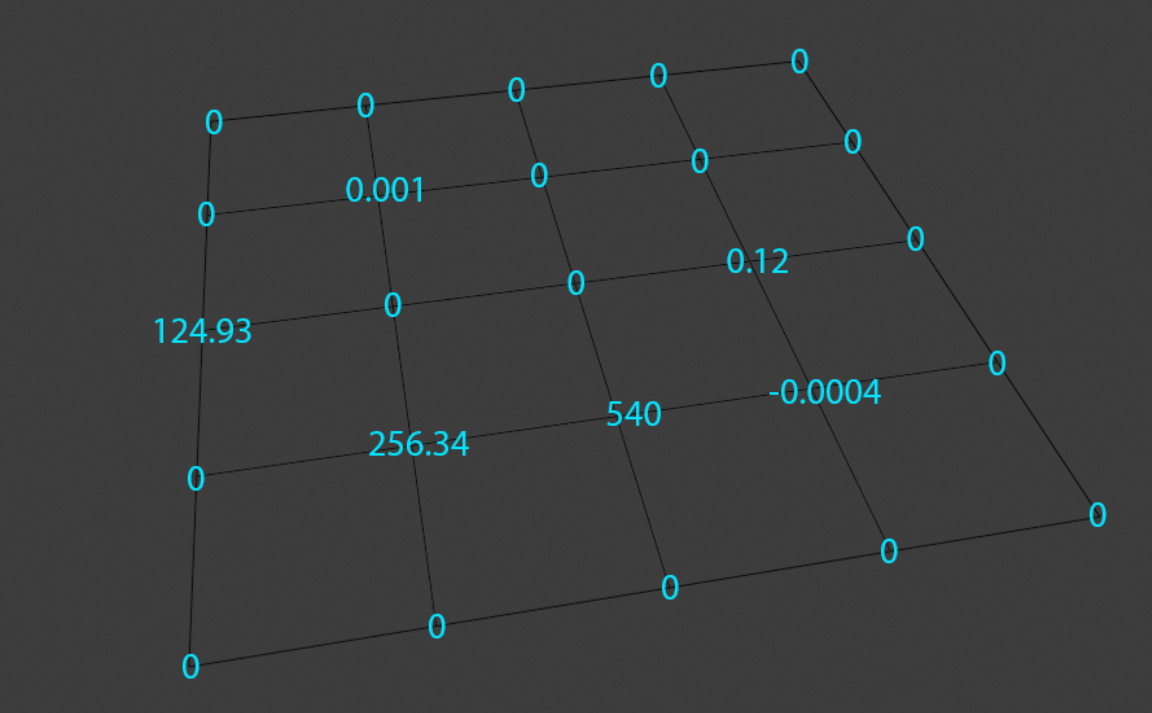
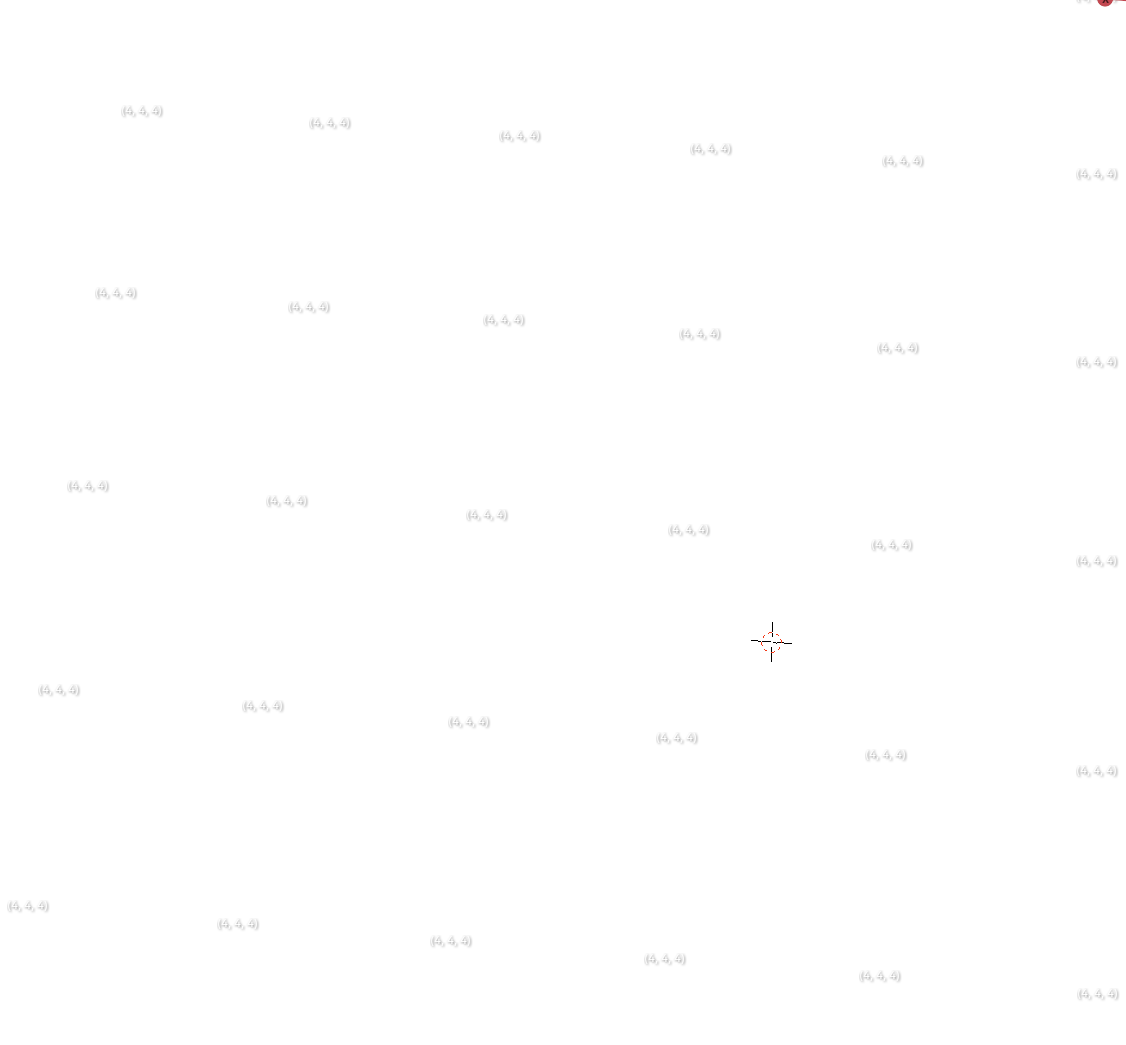
Managed to create a screen space density culling system to render every nth vert that works quite well!
There’s not much effect on readability but the performance gains are incredible.
From a UX perspective it’s hard to see IF anything is being culled, so you might not know you’re currently to far zoomed in. I’ll publish a draft PR so you can see for yourself if you’d like! The value to increase the cell size/culling is just 1 variable
@Julian_Plak Hi, I’ve seen you submitted a PR for readability improvements. Will there be improvements to face corner attributes too? The text for attributes sharing a vertex overlap.
White text with shadow was the original proposal. I’d love to hear if you think it’s the way to go, as it’s hard to read on a white background (which is probably mainly what the text viewer is used for). To be fair, people could easily disable the color overlay or lower the opacity. Would white text + shadow be readable enough?
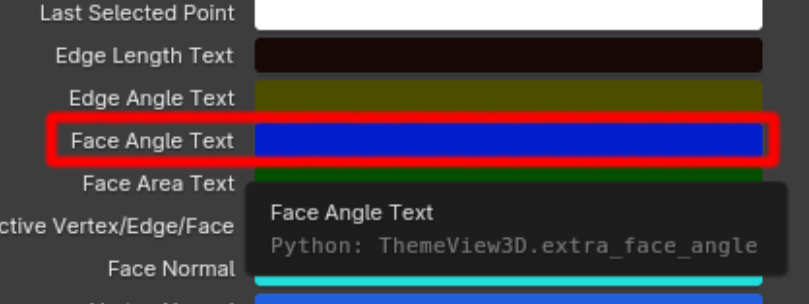
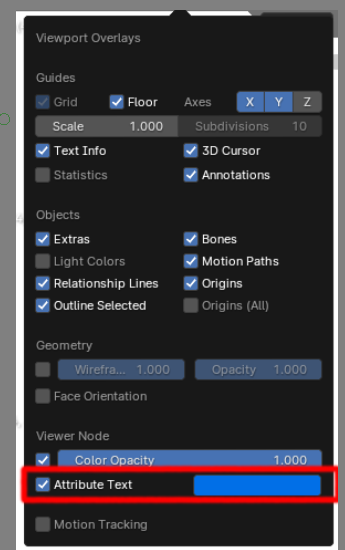
2. Configurable text color
Right now the text color can be changed in the preferences, albeit hard to find.
Should the text color be configurable? and if so, should it be editable from the preference window? or would it be preferable to add a color picker to the overlay window like this:
3. Shadow intensity
Not sure if this is technically feasible, but rendering text twice creates a thicker shadow that helps a lot with readability, without having to redo the text rendering module entirely.
/* Draw twice to get darker shadows */
for (int i = 0; i < 2; i++) {
    BLF_draw(font_id,
        (vos->flag & DRW_TEXT_CACHE_STRING_PTR) ? *((const char **)vos->str) : vos->str,
        vos->str_len);
}
Would this be preferable from a readability stand-point?
If anyone knows a way to get a deeper shadow with the existing Eevee text renderer, please shout!
Definately in the overlays. I wish all overlay colors like camera guides would be removed from theme. You need different color of text based on what your scene looks like. You shouldnt have to change theme to read text on white or back scene
@Julian_Plak thanks so much for working on this! It is incredibly useful for finally understanding and debugging some of my networks.
I have been using pure white for most things, so the drop shadow sounds like a great idea. Color option in the overlay options would be great, as well as font size and especially decimal point count for floats.
Just an idea…
Maybe the color could be set on the node itself?
So… different viewers, different colors… Would that be useful?
Also, the viewer node could set the colors for the displayed vertex colors, and what their range is, because that 0 to 1 black and white is very restricting. Sure, a map to range can be used for that, but this may be cleaner?..
I see the readability improvements are merged in 4.1. Thanks and congrats!
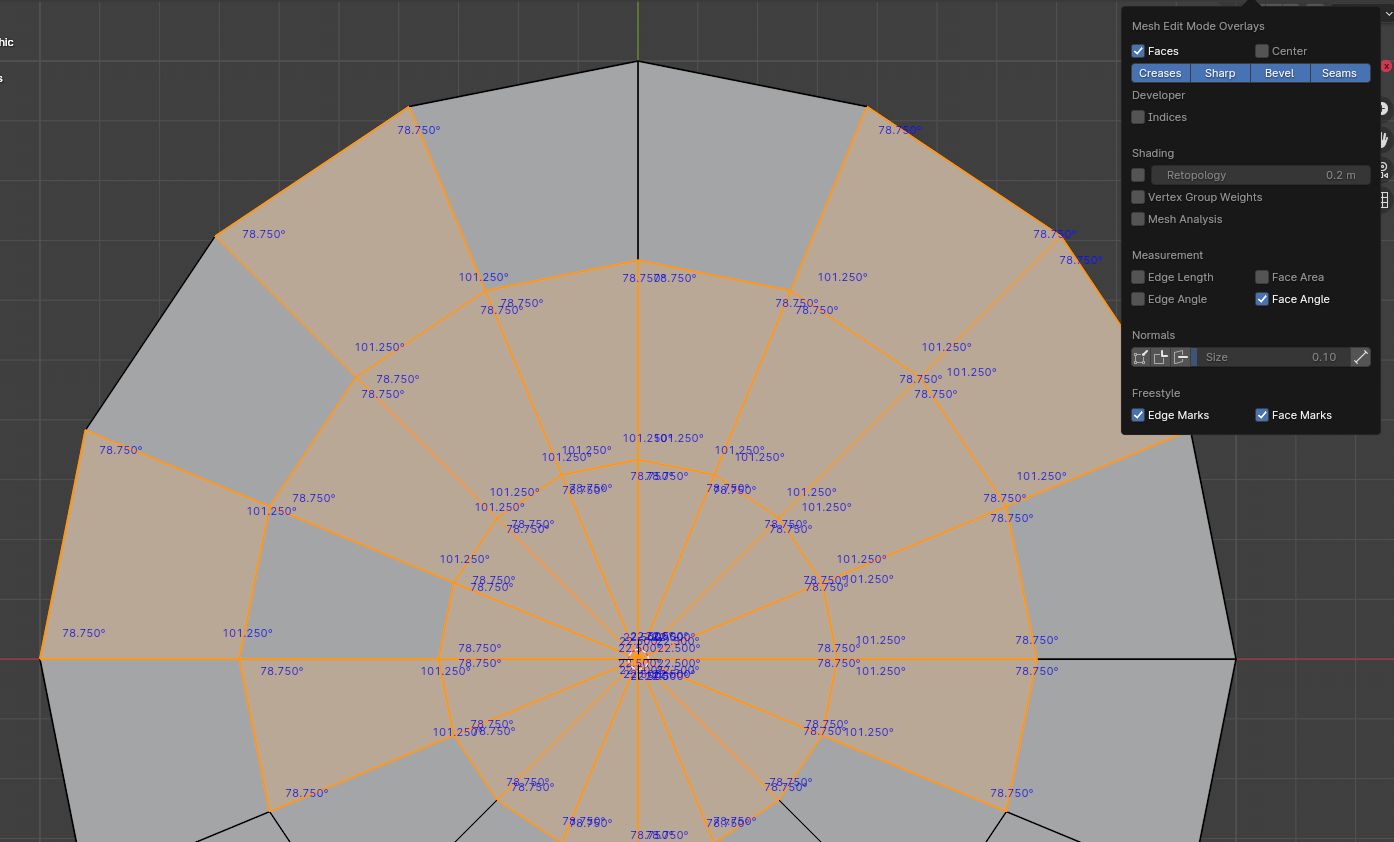
Regarding face corner attributes I guess you can see the measurement overlay for face angles in edit mode. Not really readable sometimes because of how text are aligned, but I think it’s still better than complete overlap.