I do not know what color upsampling technique most spectral renderers are actually using.
Mitsuba 2 is using the paper that @smilebags eventually intends to implement (as I understand)
I don’t know what that paper was called again but it’s burried within this thread a few times by now.
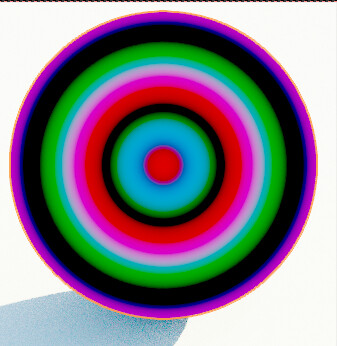
Neatly, he did just give you what the take in Spectral Cycles currently looks like.
Meanwhile, I expanded the Additive / Multiplicative Color chart real quick:
Top Row: using RGB
Bottom Row: using reconstructed Spectra)
Left two are additive (they work like light sources)
Right two are multiplicative (they work like reflected light)
To be clear, both rows are rendered in the same scene at the same time in the Spectral branch. The difference is, that on top I only used color inputs (yellow sockets) whereas on the bottom it’s spectral (red) sockets all the way through.
The center of the multiplicative Spectral RGB triangle is actually brown, not neutral grey. Which is a direct result of this spectral overlap. But additively you get grey, just as you’d expect.
You can also see, that the additive behavior of RGB Colors and Spectra is identical, but multiplicative there are big differences. (The RGB version becomes much darker as the colors are treated as if they were fully saturated when, actually, they are not)
Note: I opted to normalize these such that the “amount of color” you use for each adds up to 1, so in the additive case, in the center, it should amount to RGB 1/3 1/3 1/3, not 1 1 1 - or for the CMY one, it’d be 2/3 2/3 2/3 which is why that one is brighter here.
In the multiplicative case, it’s not so straight forward to predict which colors would appear where since, unlike the additive case, multiplying spectra is gonna crucially and fundamentally depend on what those spectra are. But effectively, the center of the multiplicative RGB triangle would be what happens if you multiply the spectra of R, G, B, and then take the third root: (R*G*B)^(1/3)
This is equivalent to using watercolors or inks where you dilute each color such that it absorbs three times less than normally, and then add the three diluted colors together. If you poured them together undiluted, it’d result in something darker.
If you ever worked with watercolors and just randomly mixed just about every color in there together, you’d find that the mixture tends towards a weird off brown. So this seems pretty accurate to me.
If you want to play around with it, here’s the blend file:
https://www.dropbox.com/s/vpvr8bcvvrw4dj6/Basic%20Color%20Test%20Spectralized%20Expanded.blend?dl=0
The top row should work whether you render spectrally or not. So it should be possible to compare that row between regular and spectral Cycles. The bottom row is gonna cause issues without spectral rendering.
I noticed there was some bug with the color sockets though. I’m not sure why, but sometimes one of the colors would go through wrong when using Separate RGB or Separate XYZ (and the other one would work) - it’s not specific to one of those separate nodes. One time one worked, another time the other. Definitely something weird going on there. @pembem22 @smilebags