I’d argue, as even with the current spectral curves, ideally you’d want what amounts to a material library. Hardly anybody will even directly want to fiddle with spectra. The curve version is just about doable, but filling in an entire matrix correctly is gonna be tough, no matter what. (Though fwiw many of the tools you’d need for this, especially in heat map form, would already be in Blender: It’d be akin to painting a monochrome texture)
Really, if you want a proper way to fiddle with spectra that aren’t just measured and thus extracted from nature, you’d (eventually) want a whole mode centered around this, with plenty of tools to help you visualize the results in various scenarios.
Like, effectively I’d imagine a route where, in the shader node, you only ever use either upsampled RGB values or specific spectra from a large library. And you could add to that library in a variety of ways. Stuff like:
- drag and drop a spectral data file into Blender
- build such a file yourself with external tools (and then import it)
- build it yourself using a spectrum maker that could be in Blender
I’d guess that Everything Nodes, once those happen, would pave a way to make this kind of idea more flexible. But it’d be a new area to maintain of course. Still, to meaningfully build spectra with special interesting properties that you can’t just measure something for to obtain, is gonna require actual tools with powerful previews and such to use. Else you’ll have a very hard time generating a specific shade that initially looks one way and then, after a bunch of bounces, will look another. Especially once fluorescene actually is considered, if that ever happens.
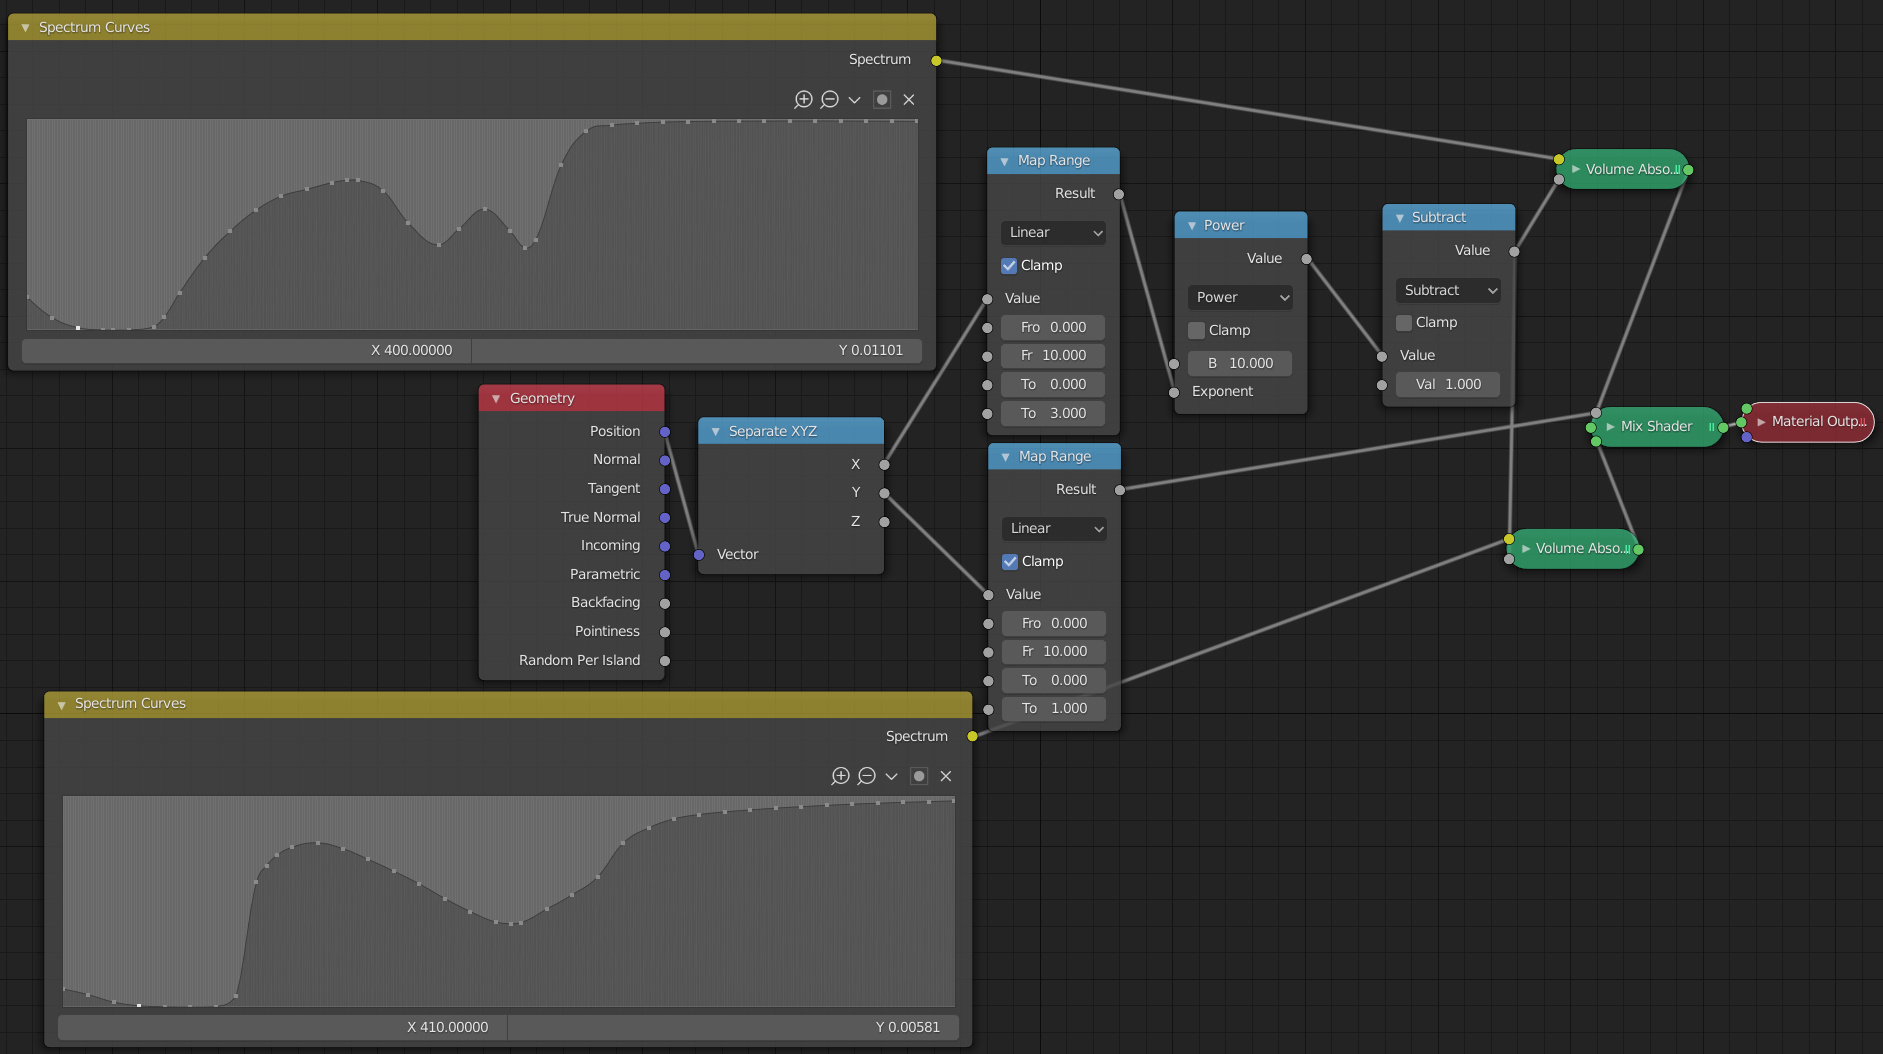
Btw, on that front, one rather easy thing that would be nice to have is what amounts to a spectral gamma correction. I.e. simply take spectra to a power. This is useful because any absorption spectrum with unclear units is equivalent to a whole family of transmission spectra defined by taking any potential transmission spectrum to a specific power.
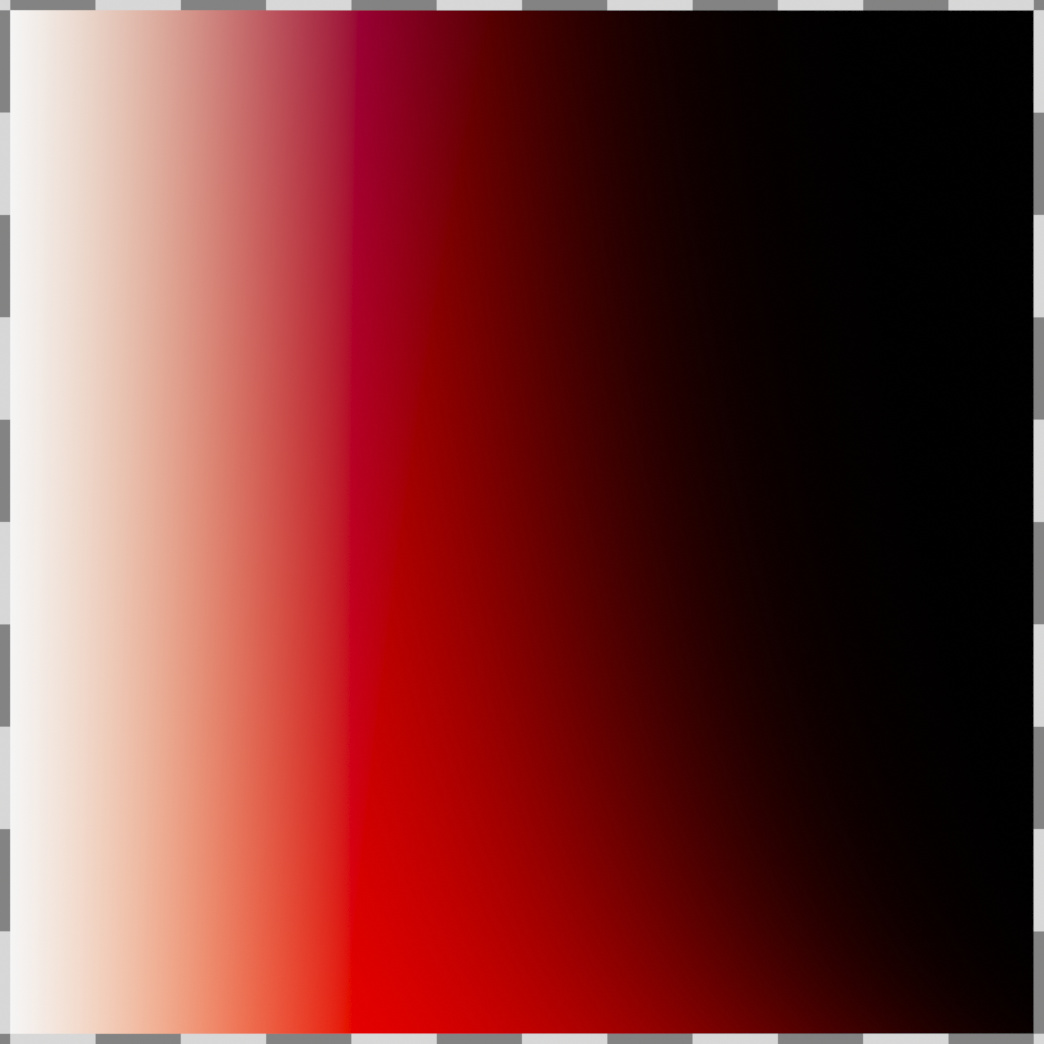
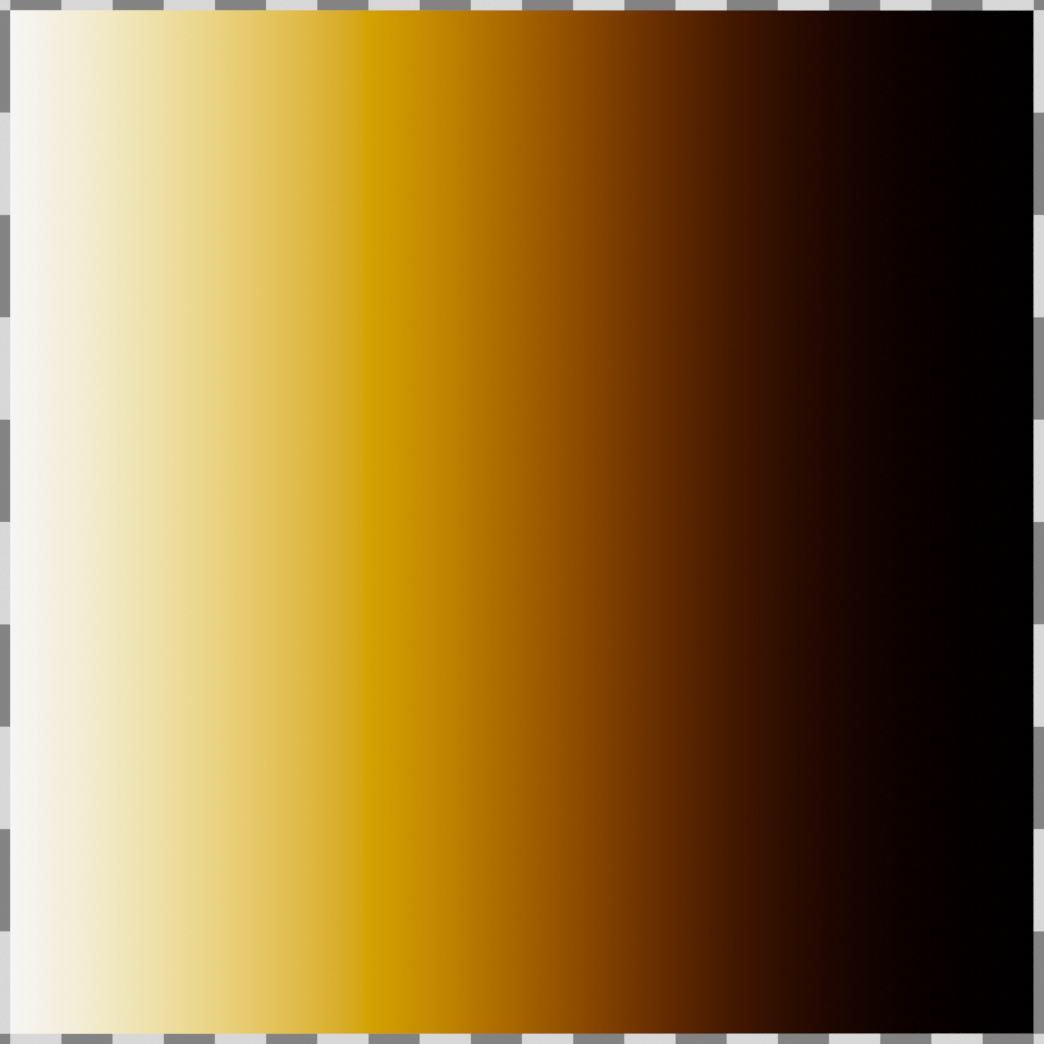
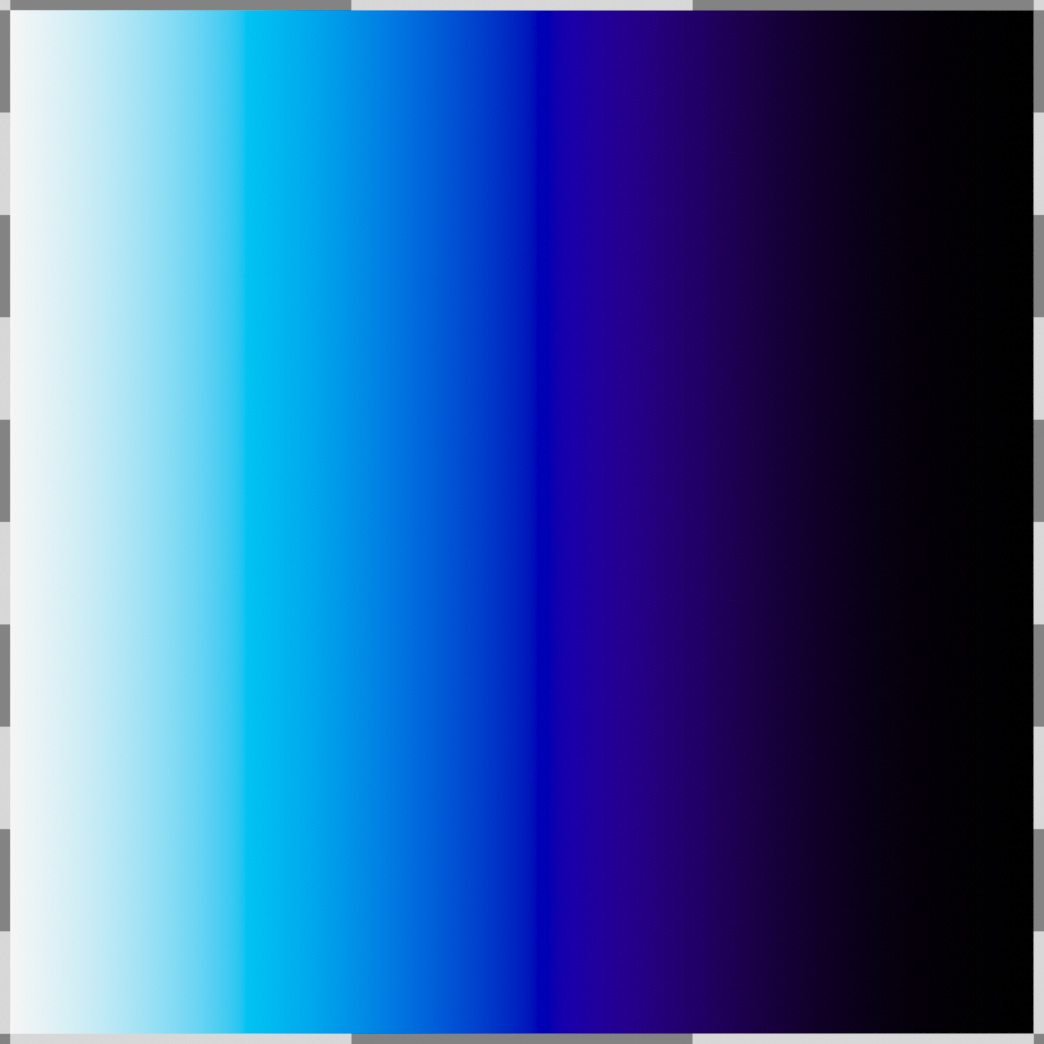
For instance, in the data set I converted, if you try out the spectra there as reflection spectra, they’ll all look really pale. You’d have to take them to some power before the actual colors you’d likely want to go for start showing.
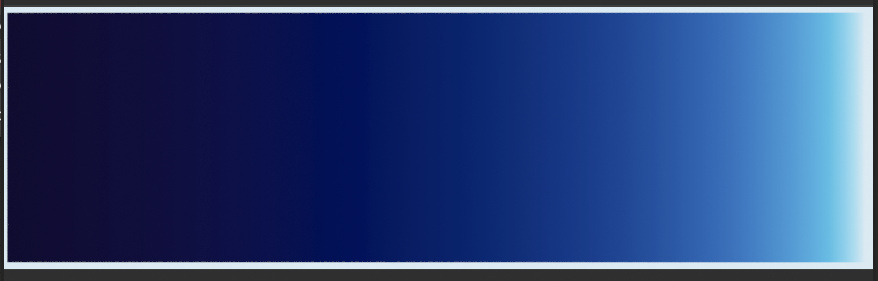
I specifically normalized them such that the top and bottom most extreme values are roughly equally far away from the extremes that are 0 and 1, in order to hopefully minimize floating point issues, and improve ease of putting them in as a curve. But as reflection spectra, that just doesn’t suffice. Like, the ones for blood will end up looking a pale orangeish yellow (though interestingly and nicely, the shadows, where multiple bounces happen, end up becoming red)