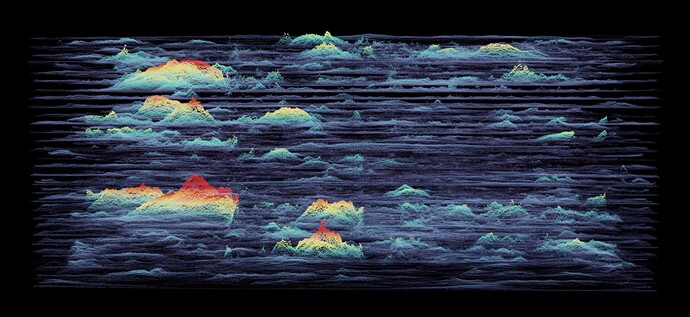
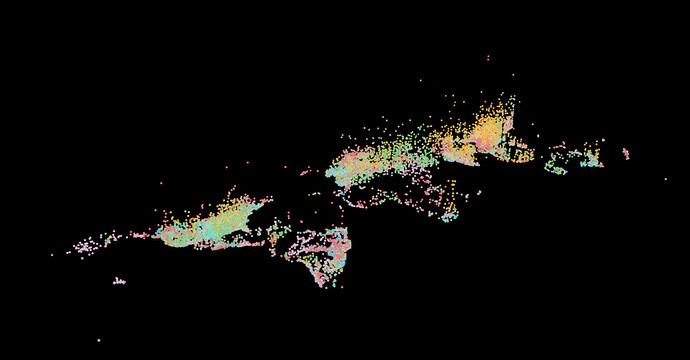
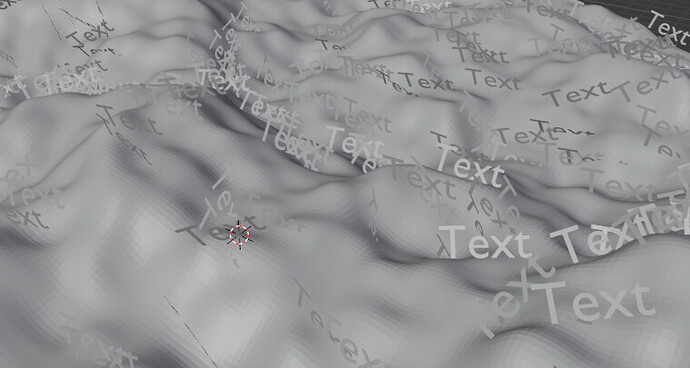
For example here.
I have 30 years of global data. I’d like to plot the year for every # of lines. As it is now, I’d need to do this by hand. Best case scenario I create an array of text objects. Realize isntances, then manually change each strings value.
Or here, what if I wanted to label every point above a certain threshold?
Or, if I have a topographical map and I want to plot the elevations across?
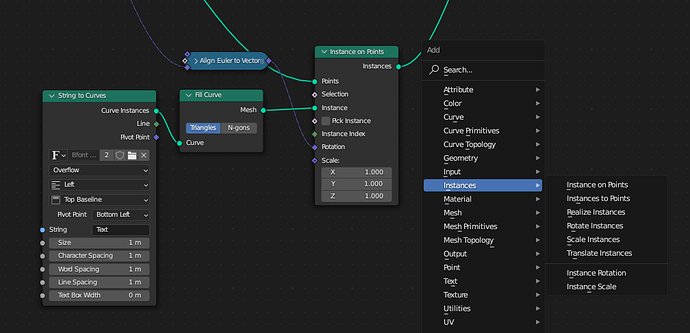
The string nodes don’t take fields as input
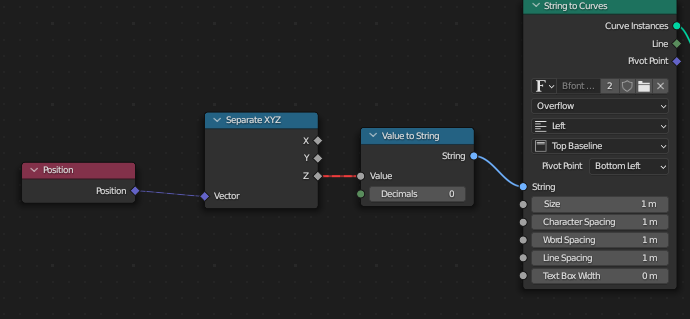
And if I plug my string to curves as an instance, there are no nodes to update the instances information.
When they add loops this will be easy as we can just loop over our locations and put a unique text there. But for now it’s not possible procedurally.
