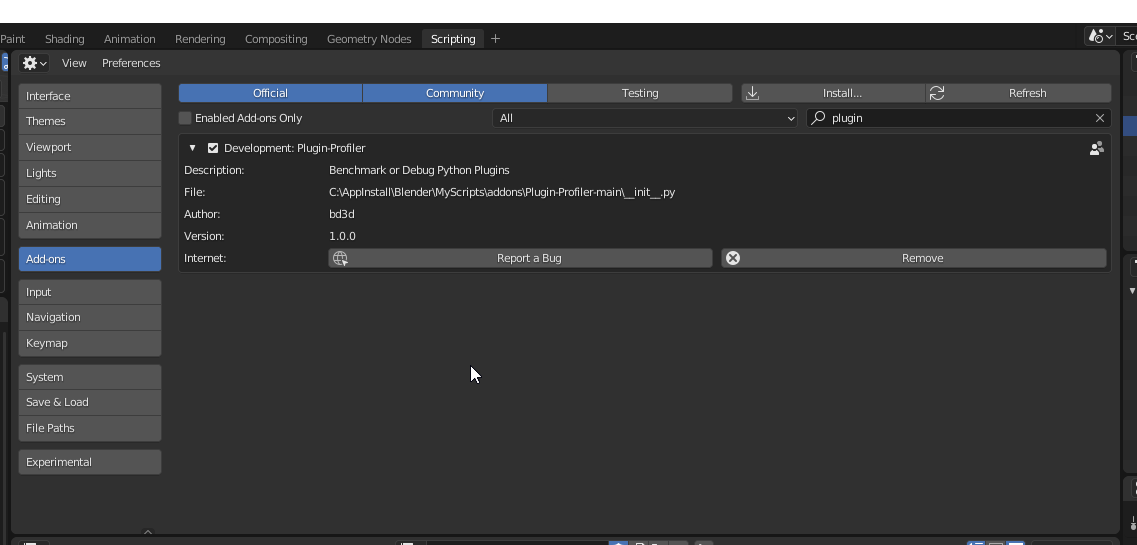
I’m the author of a large multi-module plugin, in the quest of profiling my work, today I’ve made a standalone addon to help developers optimize/debug their plugins. (it can also work with the native blender python code).
The main features consist of:
An execution tracker, it will print every python function call in real time, you are able to filter the calls by modules/functions, & save these filters as presets when swapping from one project to another
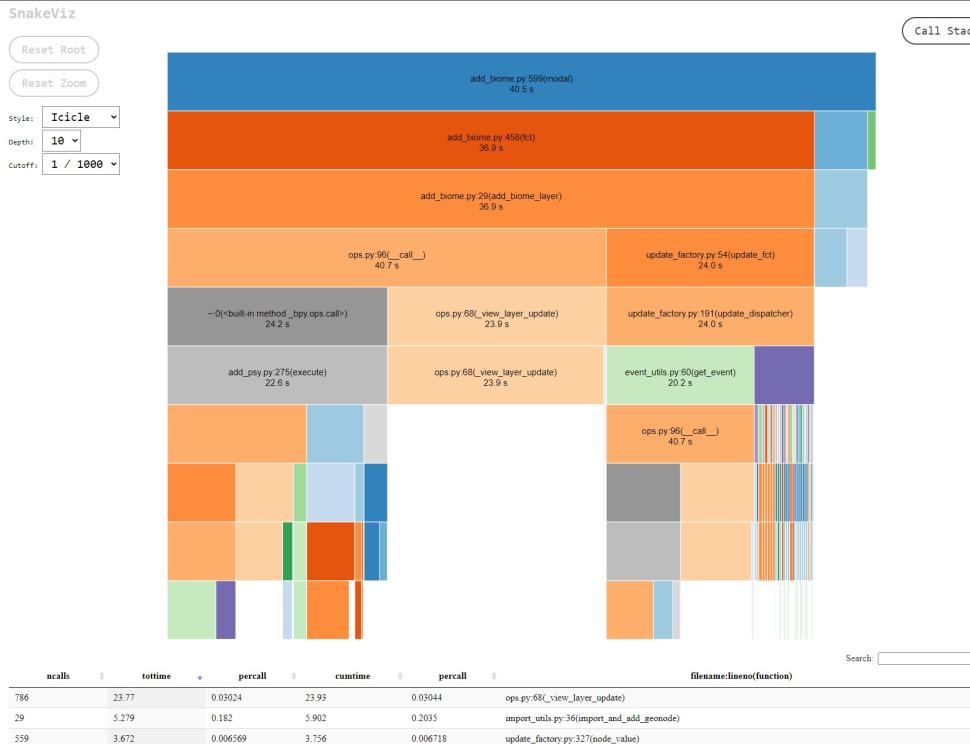
A benchmark tool, that will record and then generate statistics of the session function calls, it is linked to snakeviz analytic app, you will need to pip install snakeviz on your console first in order to visualize the graph. This is the kind of graph it can produce.
linux is not supported for the snakeviz subprocess.PopOpen() command call, a little help is welcome in that area
There might be a crash related to a blender bug with the export log operator. somehow this operator is incapable of running fileselect_add() (maybe just related to my computer?to confirm).
If you have ideas on tools we could add to this toolset don’t hesitate to comment
For debugging python, I’ve always used Blender Development - Visual Studio Marketplace with VSCode. It allows you to put breakpoints both in the addon as well as blender core (or even both if you attach a debugger to the running blender instance).
BTW, if you are looking for ideas of tools and things to enhance developers’ life inside Blender, maybe this topic can be a nice thing to look at:
e class="onebox discoursetopic" data-onebox-src="https://blenderartists.org/t/essential-text-editor-add-ons-for-coders/1163857">
Blender Artists Community – 8 Jun 19
This thread is for sharing add-ons which will modernize, expand and ease coding in the Blender Text Editor, as Blender devs no not endorse any further development of it. ENHANCING THE TEXT EDITOR: THE CODE EDITOR: By Jerryno, Iceythe/Kaio ...
That’s why I always make releases on github, to keep full controll of the files I get in and their names. Plus It allows me to not include github specific stuff that’s useless to the addons itself, and also make quick release notes on github thanks to release tags
I played with it a bit, it 's so cool to see a console actually alive!
I was wondering it it would be possible to have a place to make it listen to text blocs in the .blend file?
hey, does this write to a log file in real-time so that function calls prior to a blender hard crash can be investigated? I have an issue at the moment where an access violation happens, but only when not launching Blender from VS Code, so I can’t debug it without manually writing to a file at various function calls to try and track it down.
if you do a release it will create a zip that doesn’t have messed up filenames.
Running it on win 10, trying to save the log crashes blender, trying to open snakeviz throws a permissions error inside the preferences that cant be dismissed. Being able to set the path to have the log saved to would be good as its putting it in the app folder which by default is write protected.