I recently added some additional tooling for people who debug with GDB, even if it’s used indirectly in e.g. vscode.
Features
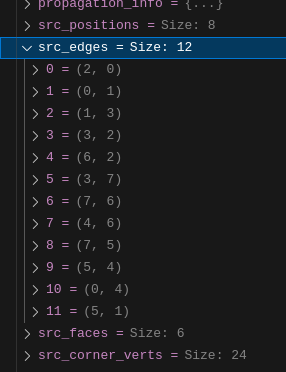
The main feature here are pretty printers for many of our code types like Vector and Map. Some of those types are also already supported by our natvis definitions. However, by implementing the pretty printers directly with the GDB Python API, it’s easier to support the more complex types like IndexMask.
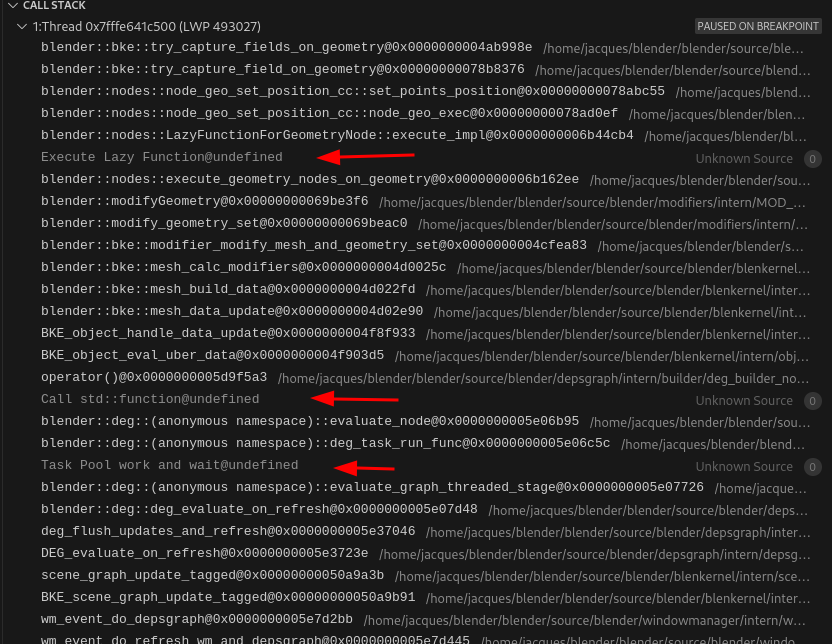
The other feature that is less important but still nice to have are frame filters. Those can automatically collapse parts of the backtrace that are likely to be irrelevant to your current work. This makes it easier to work with the backtrace.
Setup
The GDB extension is a single-file Python script that is part of Blender’s source code. It has to be loaded into GDB. How that works is described in the developer-docs.
Integration into IDEs like vscode may require additional work depending on your current setup. I added some additional guides to the developer-docs for that as well:
- There are now two example
launch.jsonconfigurations depending on which debug extension you use. - For the
C/C++ Extension, I added the-enable-frame-filterspart to thelaunch.json. - There is a new
Pretty Printingsection at the bottom.
The Native Debug extension (which I mostly use) does not support frame filters yet but pretty printers work fine. I created a PR to add support for it, but don’t know if or when this is accepted.
Let me know if anything is unclear or does not work.