I’ve been interested in comparing the Ray Accelerators in the AMD GPUs to the Ray Tracing Units in Intel GPUs to the Ray Tracing Cores in Nvidia GPUs. And now that we have HIPRT, OptiX, and Embree GPU in Cycles, we can do that. And with Cycles we can extract some extra debug information to help understand the differences.
So that’s what this comment is about. The performance of the ray accelerators/tracing cores/tracing units on different vendors. From now on I will refer to the “ray accelerators/tracing cores/tracing units” as hardware ray accelerators.
First off, testing methodology:
Testing Methodology
I took a collection of scenes from Demo Files — blender.org and rendered them on various GPUs.
For each file I disabled “Adaptive Sampling”, set the sample count to 1024, and the resolution to 1920x1080 (With the exception of the files that had square camera resolutions. These were set to 1920x1920). Other than that, everything else was left at default.
I then ran the render three times without the hardware ray acceleration and with hardware ray acceleration, removing outliers and retesting. The average of these three tests are used in the results.
Some tests were removed (and thus not published here) because they didn’t fit fully within the 8GB VRAM limit of my GPUs so I didn’t think it was fair to publish them since they would just have weird performance numbers.
All tests were run with the launch options --debug-cycles --verbose 4, which breaks out information about different parts of the rendering process for performance analysis.
Using the information provided by --debug-cycles --verbose 4, the intersection time can be extracted from the render time, allowing us to compare the performance of intersections with and without the hardware ray accelerators. More on this in the “Context” section
The GPUs I tested with were the:
RTX 4090 (Representing Nvidia)
RX 7600 (Representing AMD)
Arc A750 (Representing Intel)
Other system factors:
Blender version: 4.0.0 Alpha, branch: main, commit date: 2023-08-23 19:52, hash: 7c2dc5183d03
OS: Windows 11
Drivers:
Nvidia: 536.67
AMD: Adrenalin 23.8.1
Intel: 31.0.101.4644
Tests were done on two systems.
System 1 (Nvidia was tested here):
Ryzen 9 5950X with 64GB of RAM
System 2 (AMD and Intel were tested here):
Ryzen 5 5600 with 32GB of RAM
Secondly, Extra context:
Context
Nvidia, AMD, and Intel all offer hardware ray accelerators. And they do one primary job, do the math for the ray intersection tests quickly so the work doesn’t have to be done on the compute units on the GPU.
These hardware ray accelerators are accessed by enabling the BVH designed for each GPU. This can be done by enabling HIPRT, OptiX, and Embree GPU for each respective GPU vendor. The main difference between these features being on and off is the BVH and the performance as a result of the hardware ray accelerators being used. Other areas like shading are left practically untouched.
My main goal of this testing was to measure the relative performance of the hardware ray accelerators to the general compute units in the “intersection” part of Cycles (intersections being the part where hardware ray accelerators are used).
Thankfully with --debug-cycles --verbose 4, various intersection parts of Cycles are broken out from the rest of Cycles allowing us to look at just the intersections and how they compare.
I mentioned earlier I am measuring relative performance. I am doing this because it allows me to compare the different hardware ray accelerators to each other even though I have wildly different class GPUs (E.G. High end RTX 4090 vs a midrange RX 7600). Although, due to the complexities explained below, this isn’t exactly a fair comparison.
In a simple world, the relative performance numbers can be transferred between products with the same architecture (E.G. The relative performances scores from a RX 7600 are the same as the relative performance scores of all other RDNA3 GPUs like the RX 7900XTX). This is because the compute unit to hardware ray accelerator ratio stays the same throughout an architecture. And the relative performance numbers are measuring the performance ratio between compute units and hardware ray accelerators.
However, we do not live in a simple world. And so these relative performance numbers can not be transferred between GPUs of the same architecture. This is because things like memory size, shared memory bandwidth, work scheduling, etc, all change as you go up and down the product stack from different vendors. However, these numbers can probably be used to get a general idea of performance in the same architecture family.
Thirdly, How to understand the charts:
How to understand the charts?
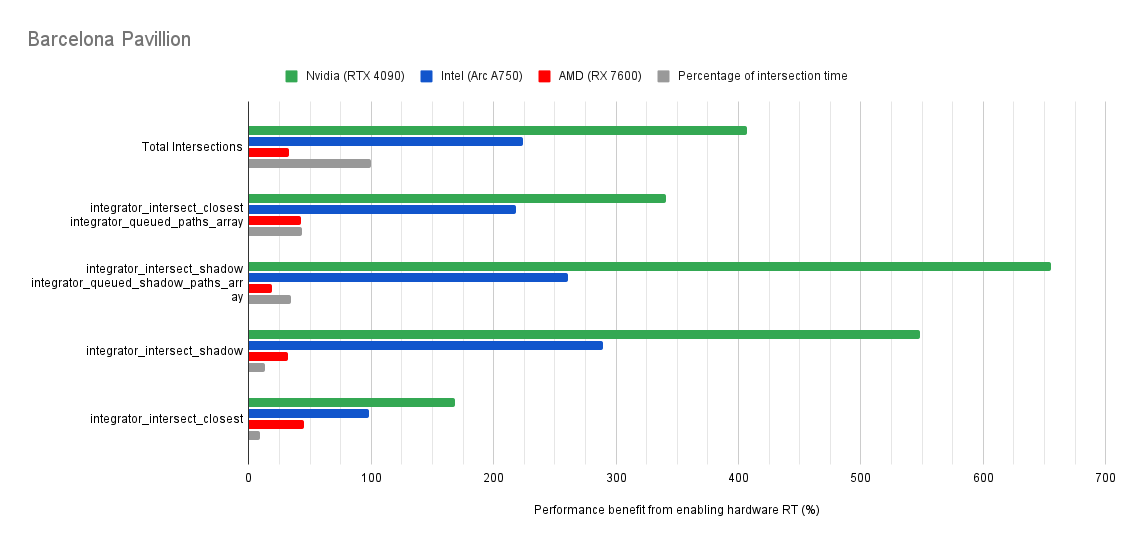
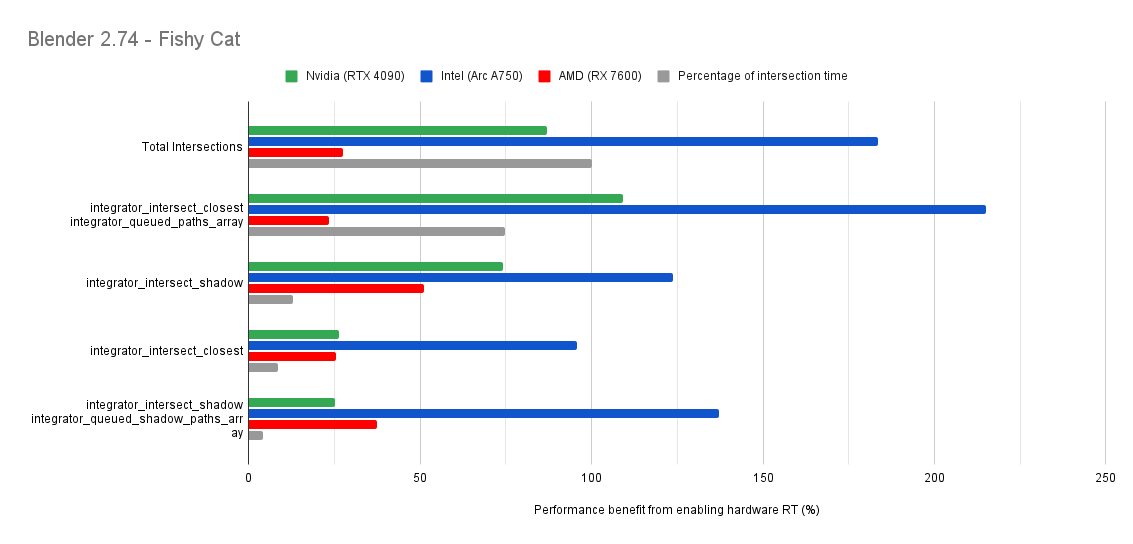
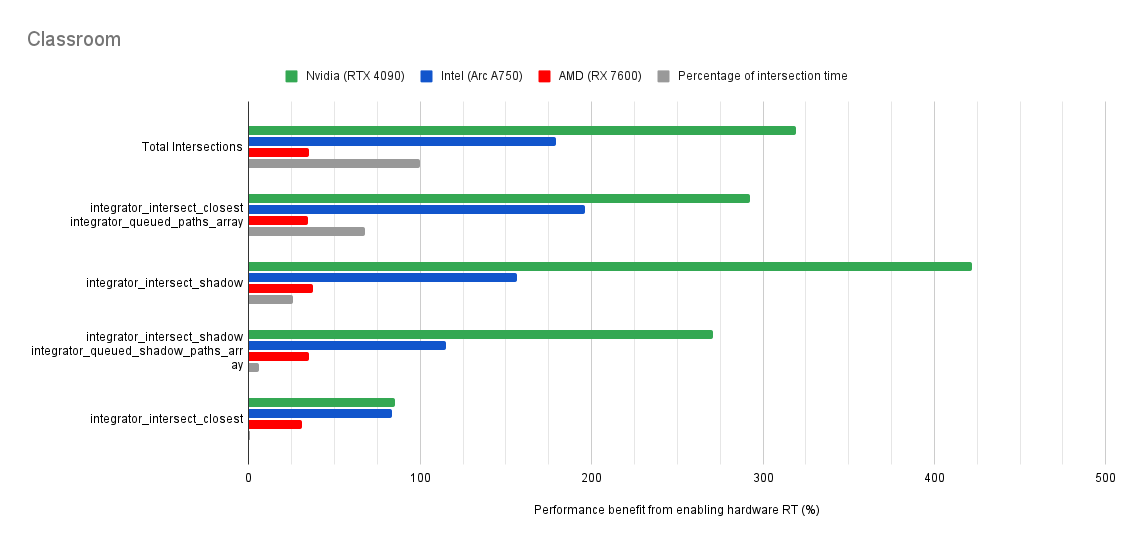
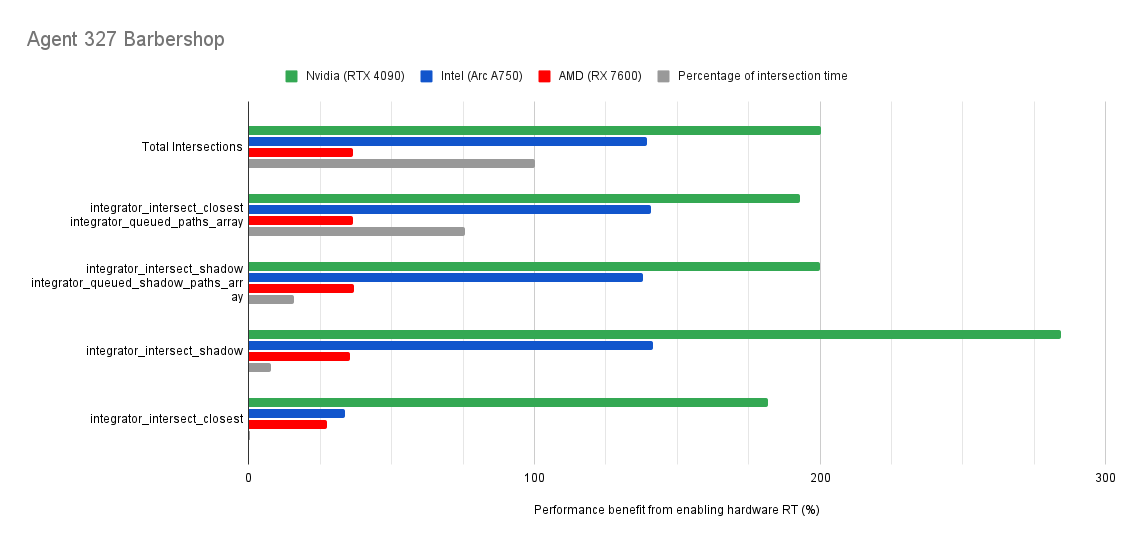
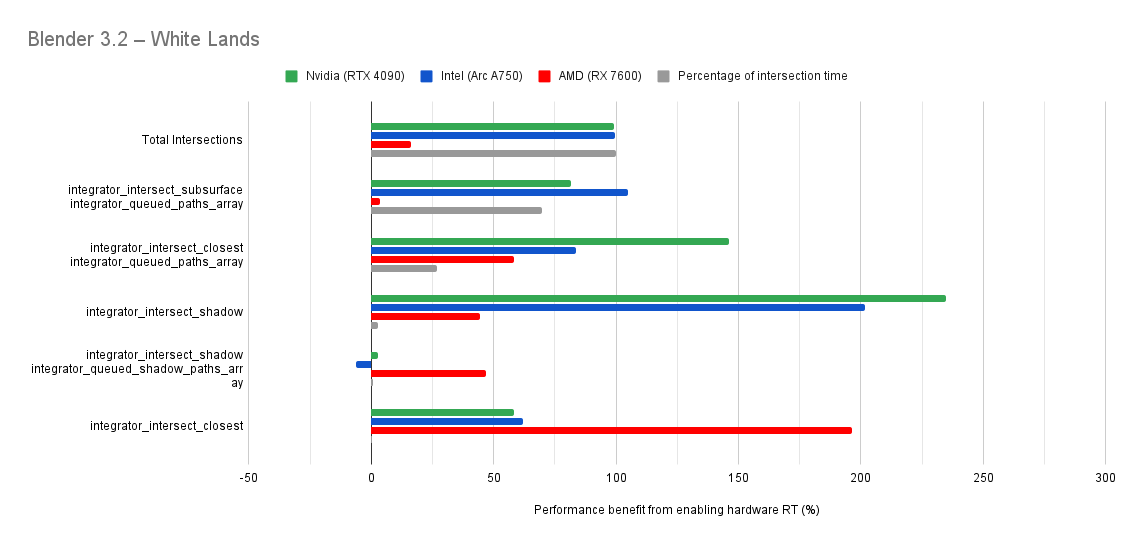
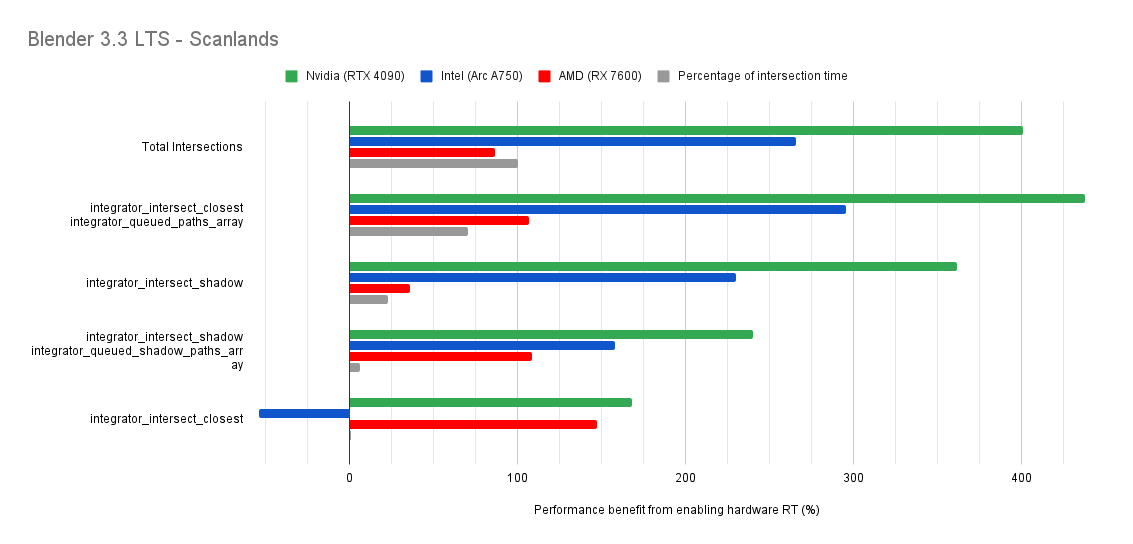
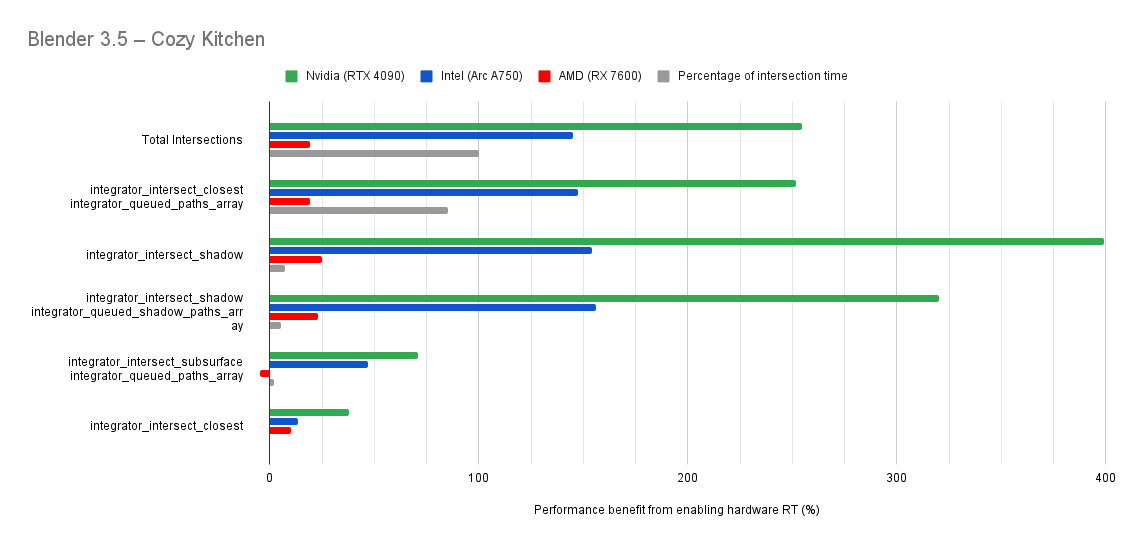
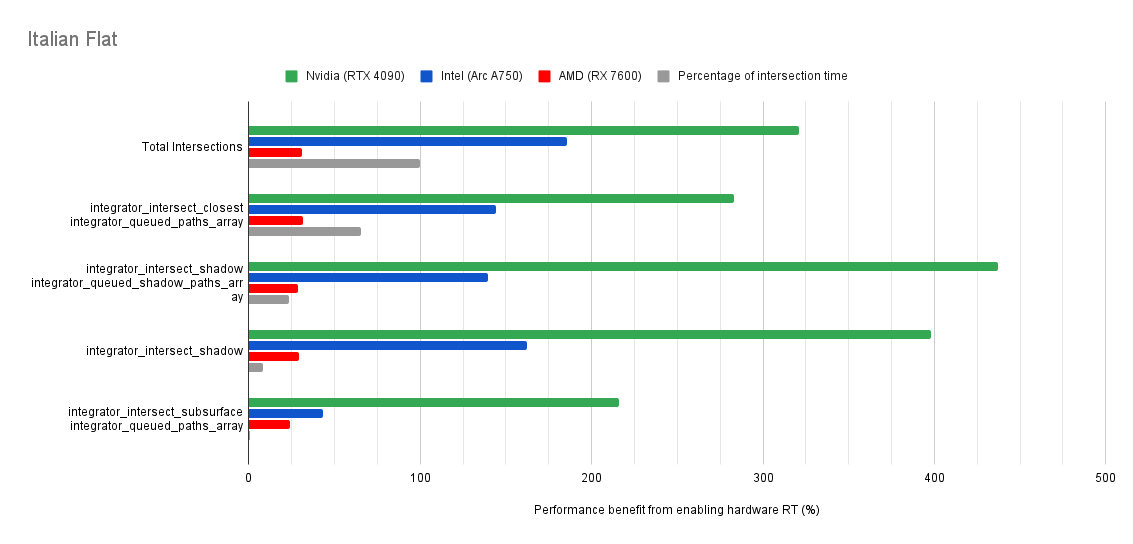
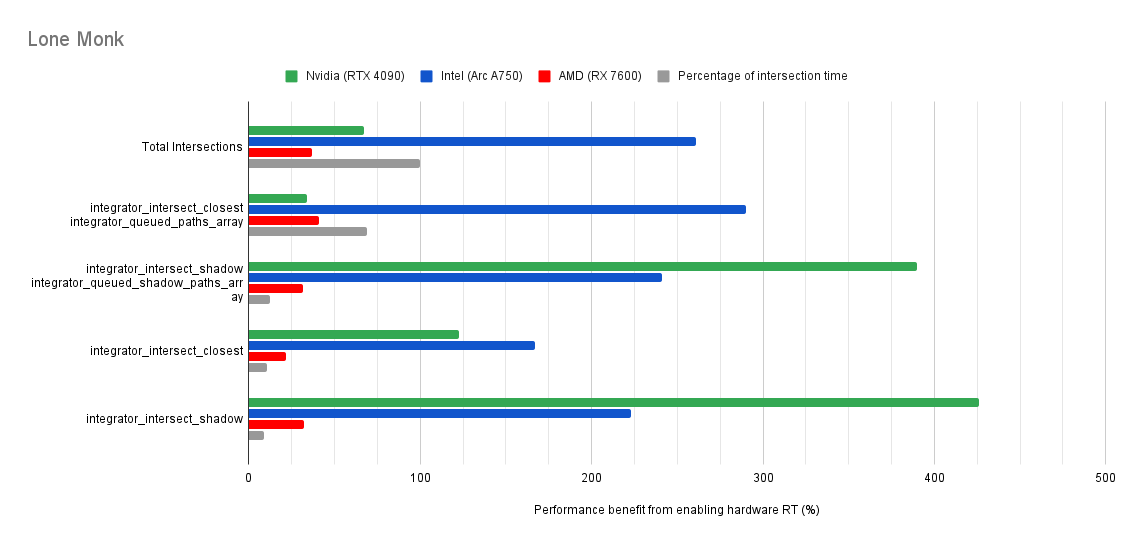
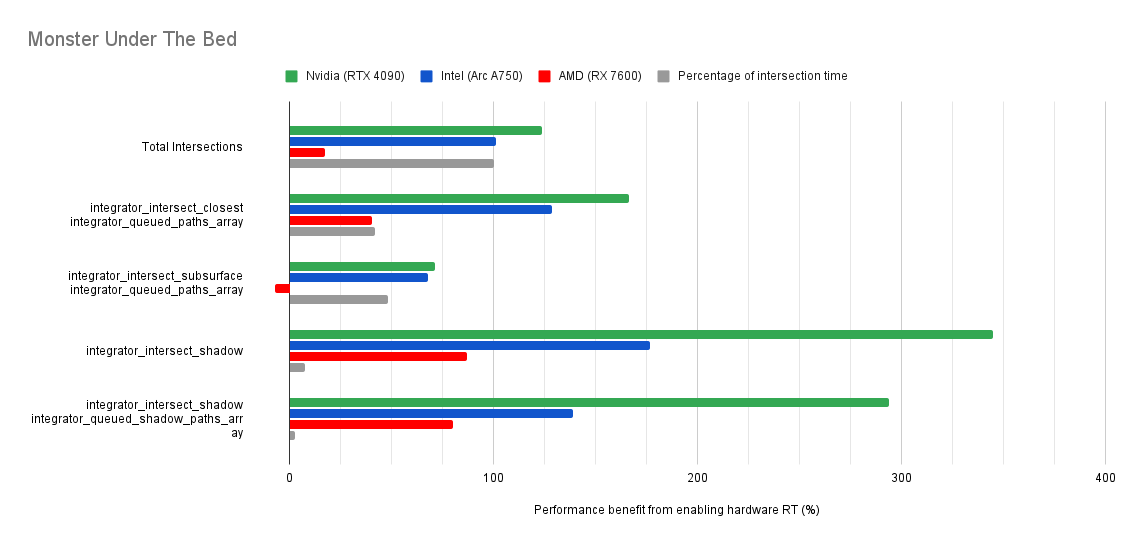
Below you will find many charts. Each chart has a title (top left) telling you which scene was tested.
The horizontal axis is the “relative performance benefit gained by enabling the hardware ray accelerators” in percentage.
- 0% means there was no benefit to intersection times offered by enabled hardware ray accelerators for intersections.
- Negative percentages means it was slower using hardware ray accelerators for intersections.
- Positive percentages means it was faster using hardware ray accelerators for intersections.
On the vertical axis you will see labels for various intersection types along with the “Total Intersections”.
- The “Total Intersections” value is the most important. It tells you how much faster all the intersections were in that scene when the hardware ray accelerators where enabled.
- Below that you will find things like
integrator_intersect_shadowandintegrator_intersect_closest. These are different types of intersections done in Cycles and I’ve broken them out just so you can see them. However an extra piece of information is required to understand them. Percentage of intersection time. You will see that one intersection type may get something like a 300% speed increase compared to 100% in others, and you may think that’s important. But if that intersection type only makes up a small portion of the total intersection time, then that speed up doesn’t matter as much. So please take into consideration the percentage of intersection time along with the intersection speed ups to weigh their importance.
How do the results transfer into rendering performance?
The results are for intersection time, not rendering performance. As such, if you see a number like “300% better intersection performance”, then don’t expect your renders to be 300% faster.
This is because intersections only make up a portion of the rendering process. And the ray hardware accelerators only speed up the intersections. So the intersections may be faster, but nothing else is. So 300% faster intersections may transfer to 50% faster rendering, or 10%, or 100%. It all depends on the ratio between ray intersection and everything else.
Along with that, although the only thing that’s supposed to be different between hardware ray accelerators on vs off is supposed to be the intersection tests. Other things like shading may run slower when hardware ray accelerators are turned on. The is because the shading done on the compute units have to share memory bandwidth (and maybe cache) with the ray accelerators which may now be accessing memory more often. That, along with changes in memory usage due to a different BVH, and changes of power distribution as a result of the ray accelerators being active can end up impacting the performance of other systems, like shading, in a negative manner.
Fourthly, disclaimers:
Disclaimers
- These tests are technically unfair. For this to be a fair comparison, every render (hardware ray accelerator on vs off, Nvidia vs AMD vs Intel) should output the exact same image at the end. This is not the case. In most scenes there is a subtle difference in noise in a small section between different setups. In other scenes, the occasional object renders slightly differently. However, since the vast majority of the render is identical between these setups, I’m happy sharing these results.
- I may be misusing the data shown here, either as a mistake or out of ignorance. Please correct me if I am wrong.
Finally, chats:
Summary:
Summary
Both Intel and Nvidia offer good hardware ray accelerator performance scaling with Embree GPU and OptiX. Anywhere between 100% - 270% for Intel, 70 - 400% on Nvidia. However AMD shows poor performance scaling with the performance benefit being between 10% and 90% (Mostly in the 30% range).
I’m honestly surprised by these results. Maybe I did something wrong on the AMD GPU? Wrong drivers maybe? Maybe AMD performance isn’t that great with the current implementation of HIPRT (It is experimental after all)? Maybe the RX 7600 doesn’t handle this type of thing well due to something like VRAM or cache, and a higher end GPU like the RX 7900XTX would show better scaling? I don’t know.
If anyone has any further insights on these poor results, I would be grateful.