Hey, this is a developer of the FLIP Fluids addon. I’m glad to add some info on our experience with interfacing with Blender as a simulation addon.
How the FLIP Fluids addon interfaces with Blender
Our simulator is written in C++ and is built as a shared library. Currently we distribute the library for Windows/Linux x64, MacOS Intel, and MacOS Apple Silicon to match the current Blender architectures.
The Python ctypes module is used to load the library and call C methods. The C methods are bindings that then call C++ methods.
import ctypes
lib = ctypes.cddl.LoadLibrary("simulator.dll")
lib.hello_world()
We wanted Blender to be responsive and usable while the simulation is running, so we run the simulation Python script in a separate thread so that it does not block the UI. The Blender Python API is not thread safe, so we make sure that the simulation script has everything it needs to run the simulation and does not need to access the API. Before the simulation begins, we export simulation parameters and mesh data using the API and then pass this into the simulation script.
While the simulation is running, events are handled within modal operator. A basic dictionary is shared between the modal operator and simulation thread for communication, such as reporting progress, or telling the simulation thread to stop.
Basic simulation loop:
Initialize simulator
for each frame:
    Set simulation parameters and mesh data
    Run simulation frame
    Retrieve and write simulation data
Simulation data is mostly written as binary data to a cache directory. When a user updates the timeline frame in Blender, a frame change handler is run which loads the simulation frame into the Blender scene. The Python struct module is used to unpack the binary data. The data is then formatted and passed to bpy.types.Mesh.from_pydata() to create a mesh and attributes are added using mesh AttributesGroups.
Sidenote on frame change handlers: A large pain point for ourselves and artists is that there can be issues with updating data on a frame change. There is an issue (#88811) that can result in frequent crashes or incorrect renders. Rendering from the command line completely works around this issue. Due to this issue, rendering from the command line is almost always necessary when rendering our simulations.
We try to make this easy for the artist by providing an operator to automatically launch a background instance of Blender to begin a command line render. However, it’s easy for the artist to miss the UI warnings we display and our documentation on this issue. Commonly, artists will have a poor first experience when they render their first simulation and find that the result is incorrect or has terminated early.
Data Exchange and Render Performance
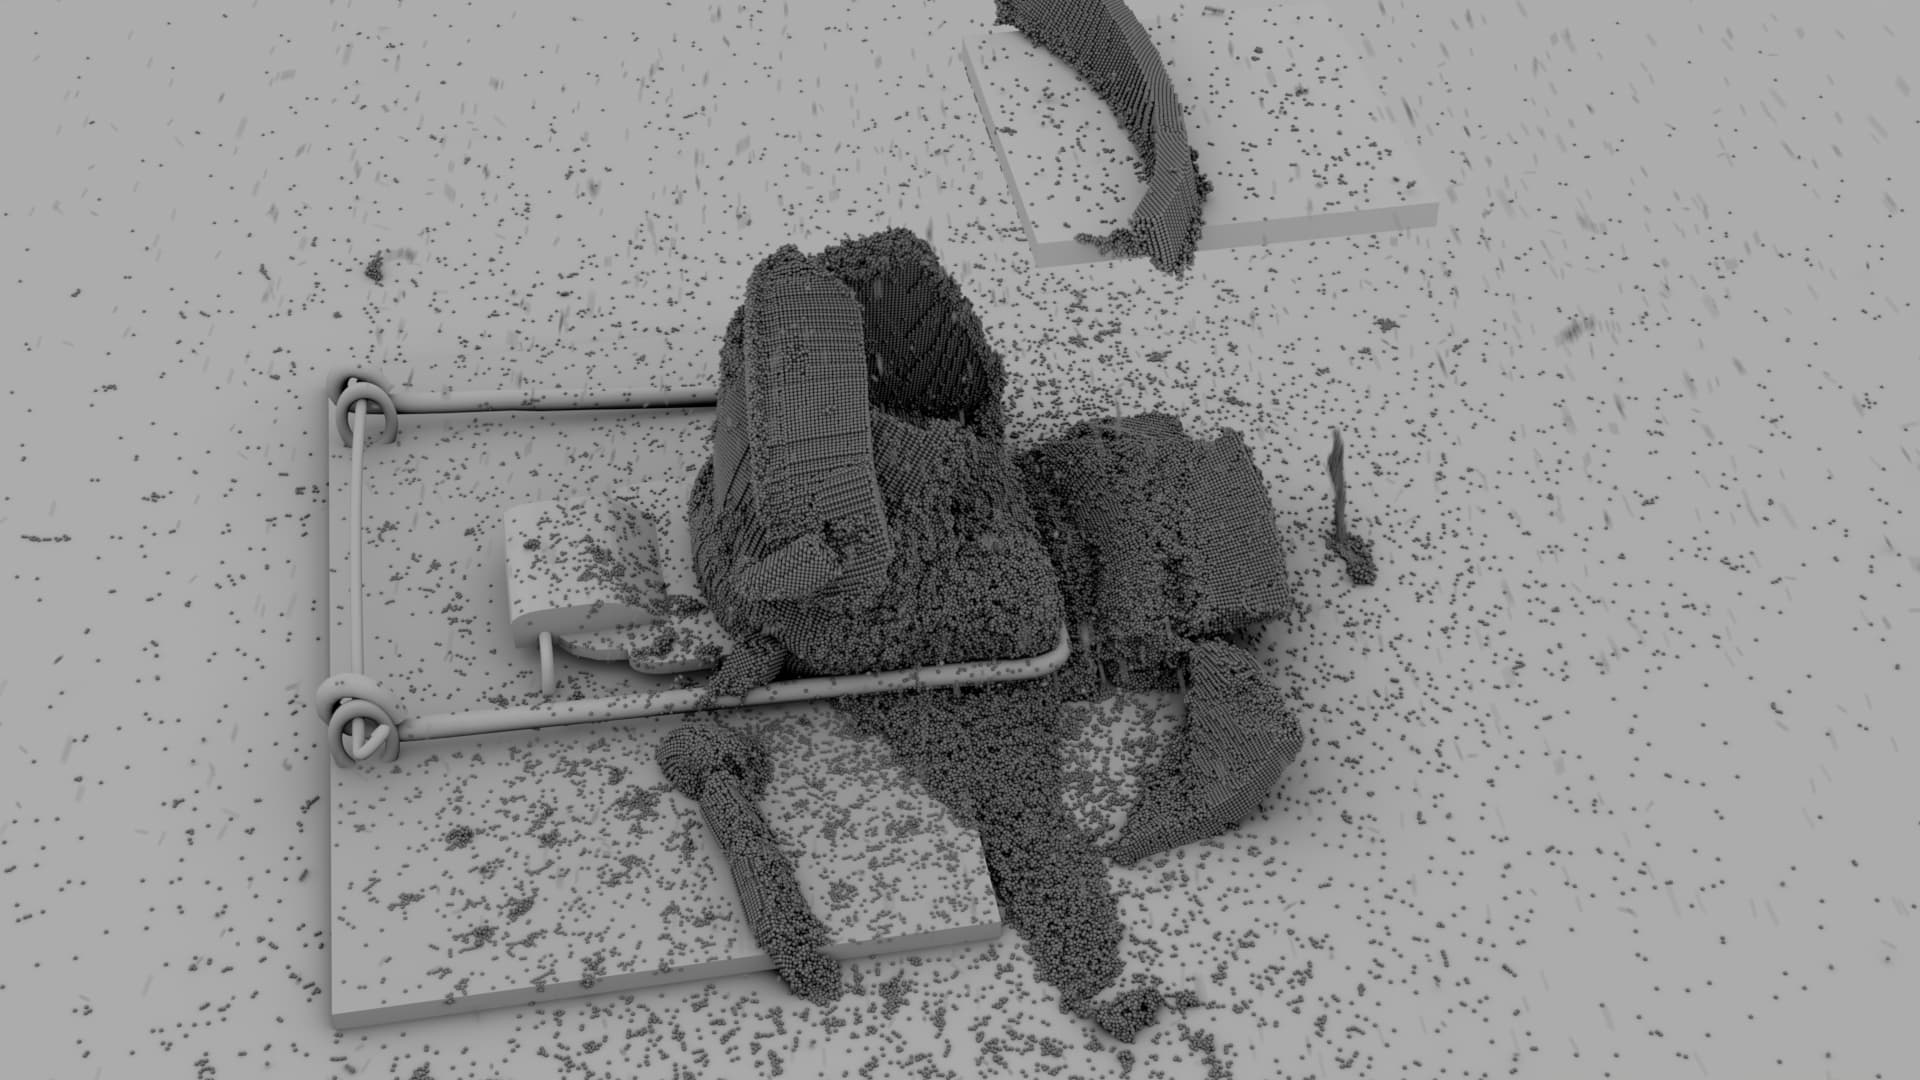
Loading and rendering large amounts of point data can be slow and can require patience. We sometimes see artists rendering particle amounts around 100M, but often not much higher. Around this amount I think that the loading and rendering times can become prohibitive.
Sidenote on Point Clouds: Point rendering performance has improved greatly with the introduction of the Point Cloud object type since Blender 3.1 and has been my favourite Blender advancement. Before point clouds, we needed to render points by instancing spheres over each vertex and was limited to around 6M - 8M points before we ran out of patience or system resources. Now with point clouds, we can rendering 100M particles in less time and with less resources.
Tip: vertex meshes can be converted to point clouds using the Geometry Nodes > Mesh to Points Node.
When loading 100M particles in the scene through Python, the majority of the time spent is within the Mesh.from_pydata() method. Reading the points from SSD and then extracting the binary data is relatively quick compared to the from_pydata call. For a viewport preview, I would suggest loading a small subset of particles to keep the loading times down.
During render, the initialization stage before the actual GPU render begins can take a significant amount of time when there are many particles. You may often spend more time on initialization compared to the GPU render. Rendering with motion blur can add extra time for loading (extra 3D velocity vector to load) and initialization.
Here’s a quick loading and render initialization test of 100M particles on an Intel i9-13900K CPU and RTX 4090GPU:
Without motion blur:
Particle Load: 1m31s, ~16 GB RAM
Render Initialization: 22s, Peak 6.1GB VRAM
Time before render begins: 1m53s
With motion blur:
Particle Load: 1m43s, ~24.8 GB RAM
Render Initialization: 4m18s, Peak 9.4 GB VRAM
Time before render begins: 6m01s
If you have a large amount of RAM/VRAM, something that can help maximize resource usage is to launch multiple render instances to work on different frames at the same time. This way, the CPU can work on initializing multiple frames at once. As far as I can tell, the initialization stage is largely single-threaded. However, this won’t be useful if you’re using all of your RAM/VRAM for a single frame.
Hope this info helps!