EEVEE shader compilation process information needed

@3di, I don’t think your post on the Khronos forum is an accurate representation of what I wrote, and not likely to lead to anything useful.

I tried to answer your questions quickly off the top of my head here. But please don’t assume developers here have the time to engage with your feature requests / requests for improvements more deeply. If there is a project to optimize compilation times we’ll consider the design as a whole, talk to the relevant people, and have more specific requests for Khronos or driver implementations. Trying to set this up as a user who does not know the specifics of the implementation is mostly going to lead to a lot of confusion and take up people’s time.

2 Likes

Trying to set organize other developers to work on improving the EEVEE shader compilation wasn’t the point of the post. I asked if it was worth delving into the code, and you said it wasn’t because opengl/vulcan graphics drivers have no good mechanism for such partial updates, and that the blue progress bar that’s taking all the time is the glsl to machine code on opengl’s side, rather than the shader graph to glsl.

So my intention was to find out if it was worth spending my time learning the GLSL on Blender’s side to try and optimise the shader compilation. So hopefully you can see I’m not an end user trying to organise everyone to start working on my feature request to improve blender…I’ve submitted and had code approved previously, and that was my intention here if it was worth it.

Chances are there is not much you can do about it. I agree with Brecht, getting on the Khronos developer support forums without an understanding of the problem area or graphics programming first isn’t going to lead to any helpful discussions.

It would be a better use of your time to test on multiple machines to see if 26 seconds is an outlier that needs to be fixed via driver update/hardware upgrade/etc and contact your GPU’s customer support over that.

Or if the problem is a bulky shader with lots of procedurals/bump/etc try to optimize/simplify it by removing subtle things and/or baking textures.

Clément Foucault @fclem13:59

ok is your issue with a scene with lots of shaders or with a special shader in particular?

  • or even with any shader?

  • 3di

3di @3di14:01

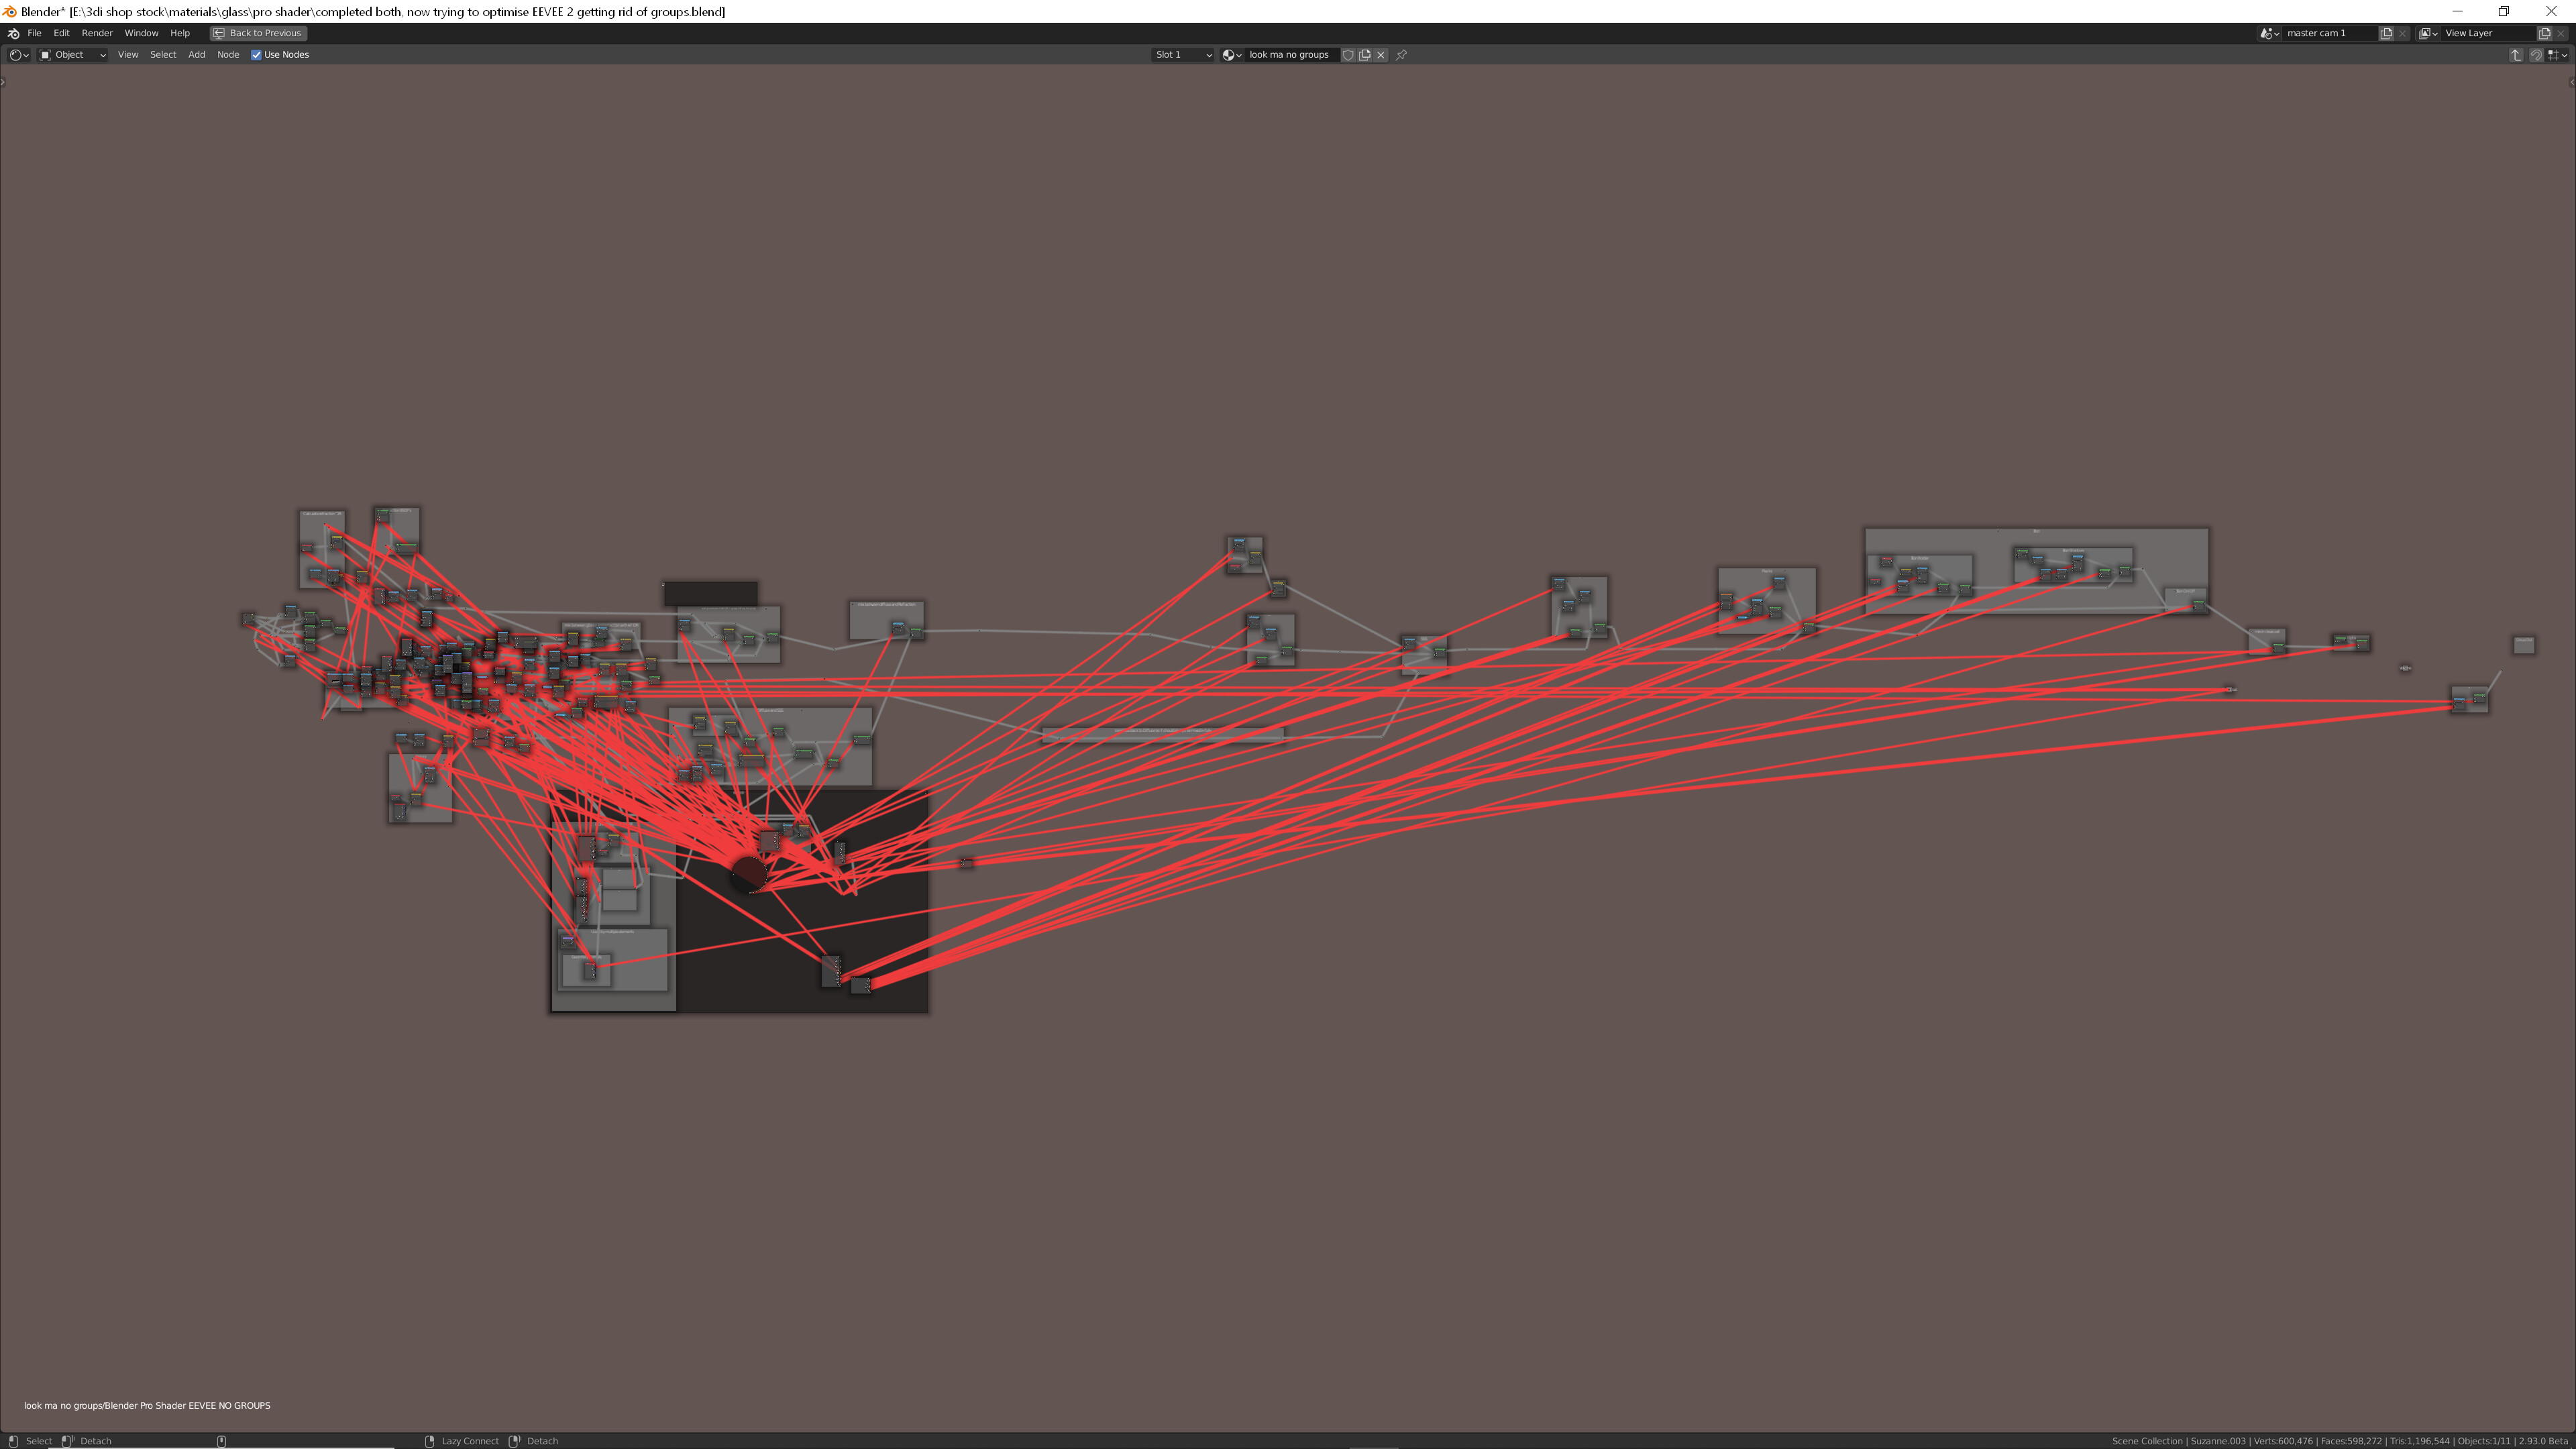
mines with a group node that gets fully re-compiled every time I plug something into one of it’s external sockets. Aiming to try and find a way to associate the already compiled glsl with the node, and then if the node remains unchanged, use the existing glsl instead of recompiling. The question is, is the recompilation indicated by the blue progress bar referring to blender’s task of converting the shader graph to glsl, or does it refer to to opengl’s progress of converting that glsl to machine code.

  • brecht thought it was almost purely reporting opengl’s progress of converting from glsl to machine code, but he wasn’t sure.

Clément Foucault @fclem14:04

Blue bar is just shader_compiled/shader_in_queue

  • so nothing about OpenGL status

  • also we already detect if a shader does not change. But we cannot optimize the “only recompile the bits that changed” because it’s bytecode that we don’t even have and could be vastly different for each GPU/vendors.

  • what we can improve tho, is that we could decouple shading from the material evaluation. but this means defered shading and is a big paradigm change frow what we have now.

  • 3di

3di @3di14:07

OK, so the bit were waiting for is shader to glsl and not glsl to machine code.

  • shader graph to glsl rather.

Clément Foucault @fclem14:08

NodeTree > glsl is done async and does not freeze. The GLSL > bytecode is freezing because drivers hangs.

  • So if it hangs for 30sec it’s driver. If you can rotate viewport for 30sec it’s Nodetree and here we could see what to do.

  • 3di

3di @3di14:10

it’s not hanging, its the blue progress bar slowly climbing, so presumably it hasn’t even begun the glsl to bytecode at this point?

  • from what I understand, which might be incorrect. blender converts shader graph to glsl, and this is what the blue progress bar shows. After this driver converts that glsl to bytecode?

Clément Foucault @fclem14:11

the blue bar is just an indication of how many shaders are still not recompiled.

  • 3di

3di @3di14:11

I only have one material

Clément Foucault @fclem14:11

blue bar shows both

  • 3di

3di @3di14:11

Or when you say shader, do you mean each node/group inside that material?

Clément Foucault @fclem14:11

if blue bar is not doing 0 > 100% instantly you don’t have only 1 material

  • 3di

3di @3di14:12

I’ll make a video

  • :+1: 1

  • one sec.

  • just one material with a group.

  • 3di

3di @3di14:30

dropbox.com/s/tux9bnenn9kgzcn/2021-04-19 14-24-26.mp4?dl=0

  • I’m getting around 12 seconds per connection here.

  • swapping blend mode to alpha blend in the settings increases shader compilation to around 24

Clément Foucault @fclem14:36

Looks like it is our nodetree folding system that is taking too long here

  • 3di

3di @3di14:36

my aim was to see if it would be possible to hash the individual nodes/groups, and when the glsl is created for that node, the hash would be used as a key for a dictionary of each nodes glsl, and then when recompiling the shader graph to glsl in future, if the hash was the same, it would use the stored glsl to build the full material, before presenting it to opengl for the conversion to bytecode.

Clément Foucault @fclem14:37

Not sure if it is glsl here that is taking the time. Do you compile blender yourself?

  • 3di

3di @3di14:37

yeah

  • i’ve done a basic patch that was approved before.

  • so i’m not completely unfamiliar with the code.

  • but i’m not great

  • I’m not sure why enabling alpha blend would double the compile time either.

Clément Foucault @fclem14:40

maybe in this case it needs multiple shaders for one material.

  • if you can maybe just run in debugger inside VisualStudio and just pause when you are waiting and see where the statck is. OR use the profiler mode.

  • 3di

3di @3di14:42

ok, i’ll do that.

  • thanks.

Clément Foucault @fclem14:42

3di my gut feeling is that it will be inside ntreeGPUMaterialNodes

  • But basically, we flatten the whole tree so if you have nested groups it can increase time quite a bit.

  • But one thing I don’t understand is why we allocate all nodes separately… this is a mystery to me. Might be a low hanging fruit to pick.

  • 3di

3di @3di14:44

Brilliant, thanks. I’ll take a look later this week, it’s been pretty quiet due to covid, and i’ve just had my first client work through for a few weeks, so best crack on with that.

  • :+1: 1
  • :+1:

Is this a copy paste from your private conversation on blender chat? Glad you got your answers but besides copying and pasting chat logs publicly without all party’s knowledge being poor form it kind of seems like threadspam.

thanks, just keeping it all together for future reference. They’re both public domain, I can’t see this as a problem…

I’m not sure “public domain” means that or how much a chat dump is helpful as future reference over notes. It would probably be more helpful to report back a summary of what the conclusions were.

I’m going to leave it as is. It’s fine. It would perhaps be better to summarise it, but I don’t have time at the moment, and don’t want to have to search through blender chat when I come back to it. At least having something here is better than nothing, just in case anyone else takes an interest in the mean time.

Sorry, didn’t mean to shoot you down, just a bit hectic at the mo.

Test 1, can the viewport still be rotated during shader update? If it can, then it’s a problem at blender’s side.

Result, approx 11 seconds it can be rotated and 3 seconds it cant. Last three seconds is the opengl conversion of glsl to bytecode (if I’ve understood germano correctly above)

All inner group nodes have been ungrouped, didn’t seem to impact shader compilation times positiviely. Just one top level group now.

Test 3: if a new node is added of the same type that already existed, and it’s connected to the same sockets on the group that the last node of the same type was, then there is no wait time.

If you connect the node to a socket it hasn’t been connected to previously, then there’s a long shader compilation again, and during that time the viewport can be rotated.

What hardware are you using? Are your drivers up to date? Does it happen on less complex node graphs as well? It really shouldn’t be taking that long. This does not seem like a problem for blender to solve, this seems like a driver/hardware performance issue on your end.

Just spent a few hours with Clem testing it. It’s just a bit too complex for EEVEE at the moment.

1 Like

Thanks for your suggestions.